This is a level 4 measurement strand activity from the Figure It Out series. It also has an achievement objective from the Level 5 Number strategies and knowledge substrand.
A PDF of the student activity is included.
Click on the image to enlarge it. Click again to close. Download PDF (499 KB)
solve problems involving time
solve problems inovle time rates
FIO, Level 4+, Measurement, Book Two, Hot Pots, pages 22 -23
computer (optional)
Activity One
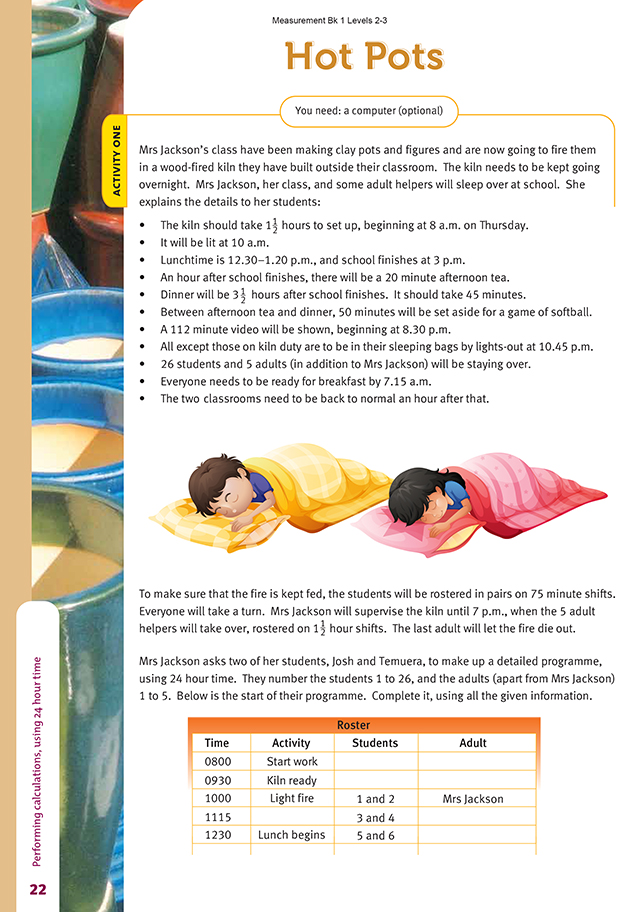
This activity has a lot of information for the students to read and absorb before they can enter it in a roster.
They will learn most if you leave them to sort the details out for themselves, but you may need to help any who have trouble with reading.
The students should start by entering the times and activities from the bullet-point list and then add the student and adult rosters. They need to be able to move between 12 and 24 hour time and to convert minutes into hours. A complicating factor is that the lines on the chart won"t all represent equal time intervals.
Activity Two
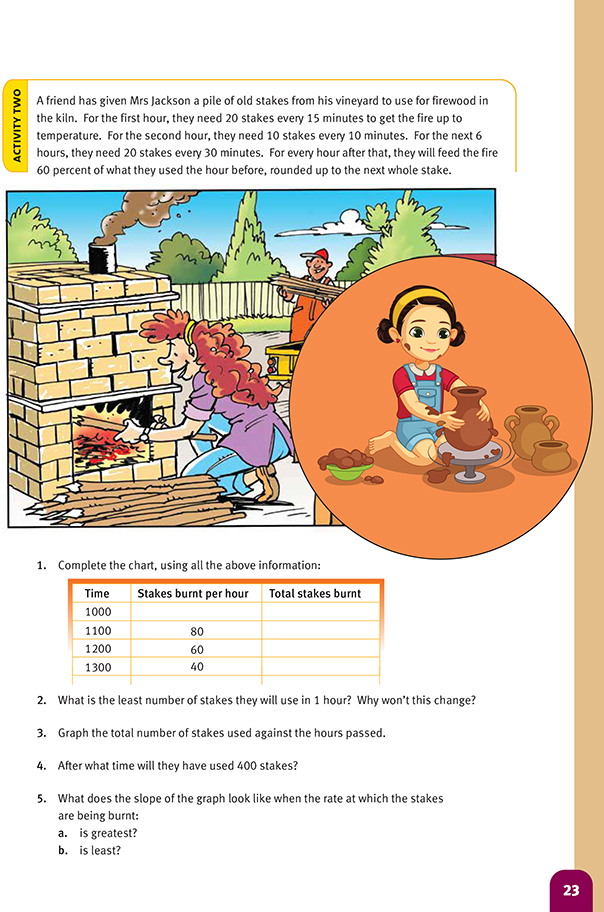
This activity relates to the rate at which fuel is fed into a kiln. Question 1 is best done as a spreadsheet so that the data can be used to make the graph required for question 3. Three columns are required:
- Time at 1 hour intervals (24 hour)
- Stakes burnt per hour
- Total stakes burnt. A formula could be used to add these.
If the students are using a computer to create the graph, they should choose the (XY) scatter graph option.
The number of stakes fed into the fire (question 2) never gets below 2 because of the rounding up. 60 percent of 2 is 1.2, but 1.2 rounded up becomes 2. Questions 4 and 5 ask the students to interpret their graphs. The steeper the slope is, the faster the rate at which the stakes are burnt.
Cross-curricular links
This activity could form part of an art or technology unit on pottery.
Achievement Objectives
Art
- Students will apply knowledge of elements and principles to make objects and images, using art-making conventions and a variety of techniques, tools, materials, processes, and procedures. (Developing Practical Knowledge in the Visual Arts, level 4)
Technology
- investigate and explain the use and operation of a range of technologies in everyday use, such as in communications (Technological Knowledge and Understanding, level 4)
- explain why people within specific technological areas carry out activities in particular ways, such as preparing a hāngi; planning a local facility (Technological Knowledge and Understanding, level 4)
Answers to Activity
Activity one
The roster could look like this:
Activity Two
1.
2. 2 stakes; because we are taking 60% of 2, then rounding the result, which takes the number back up to 2 each time.
4. Between 1800 and 1900 hours
5. a. When the rate is greatest, the graph is steepest.
b. When the rate is least, the graph is most nearly horizontal.