This is a level 5 geometry activity from the Figure It Out theme series.
A PDF of the student activity is included.
Click on the image to enlarge it. Click again to close. Download PDF (433 KB)
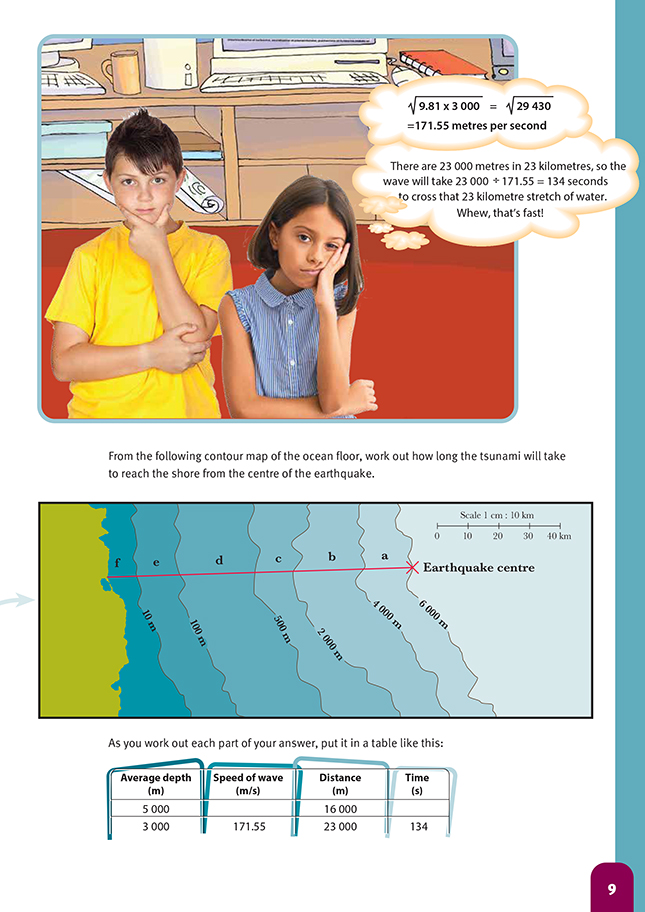
interpret a contour map
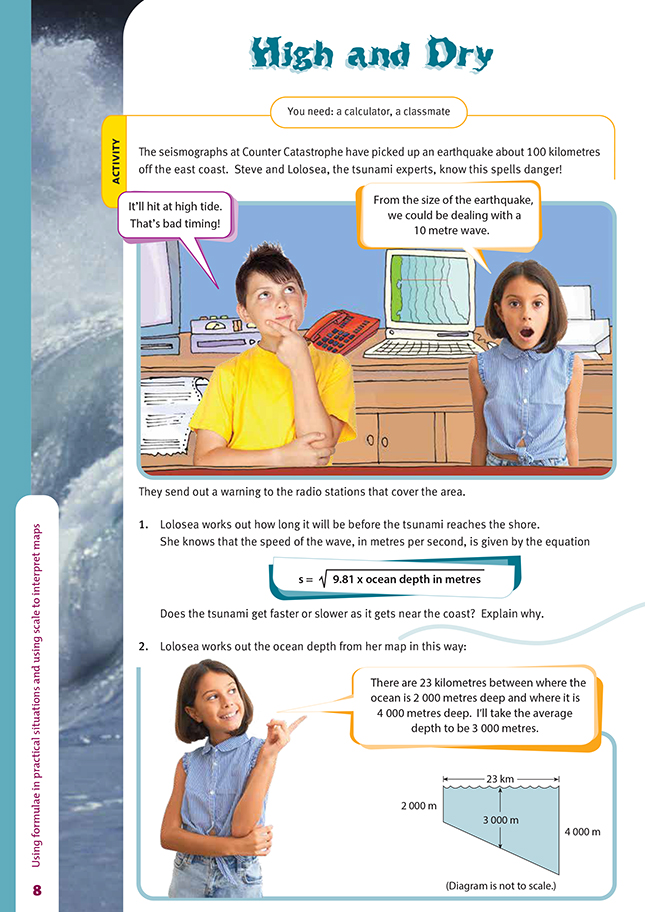
FIO, Levels 4-4+, Theme: Disasters Strike!, High and Dry, pages 8-10
A calculator
A classmate
Other mathematical ideas and processes
Students will also:
• read map contours
• investigate the relationship between distance, time, and speed
• use square roots in formulae.
One of the challenges in this activity is to understand what is meant by “contours”. Contours on a map are lines that show areas of the same height or, in the case of oceans, areas of the same depth. In the map on page 9 of the student book, the line marked 500 metres means that every bit of the ocean floor along that line is 500 metres below sea level. Likewise, the 2 000 metre line shows all the terrain that is 2 000 metres deep. However, even with this information, it can be difficult for the students to visualise the terrain by simply looking at a map and mentally processing the numbers. In this situation, the students can learn a lot by generating a profile of the ocean floor using the “cross section” method. To do this, they could follow these steps:
i. Draw a set of axes. Let the x axis represent horizontal distance and the y axis vertical elevation. The scale used for the axes must be the same as that used on the map, that is, 1 centimetre represents 10 kilometres on the horizontal. For the vertical scale, make 1 centimetre represent 1 000 metres.
Ocean floor contours, axes only:
ii. Overlay your axes on the contour map so that the horizontal axis matches up exactly with the line of the transect (the line showing the direction in which the tsunami will move). Make a mark on the axis where each contour line crosses (the coastline crosses at 0).
iii. For each of the points you have marked along the horizontal axis, plot the depth. Join the points with a smooth curve, and you will have a scale approximation of the profile of the ocean floor.
Alternatively, the students could enter the distance and the depths into a spreadsheet and use the program to draw a similar graph (select XY Scatter) of the ocean floor profile. Note that the profile shown is exaggerated because of the scale used. To get an accurate representation, they would need to use the same scale on both axes.
As a reinforcement exercise, the students could be given photocopies of any contour map with a marked cross section. Their task is to generate the profile. This could lead to a discussion about how terrain affects travelling time, especially if journeying on foot.
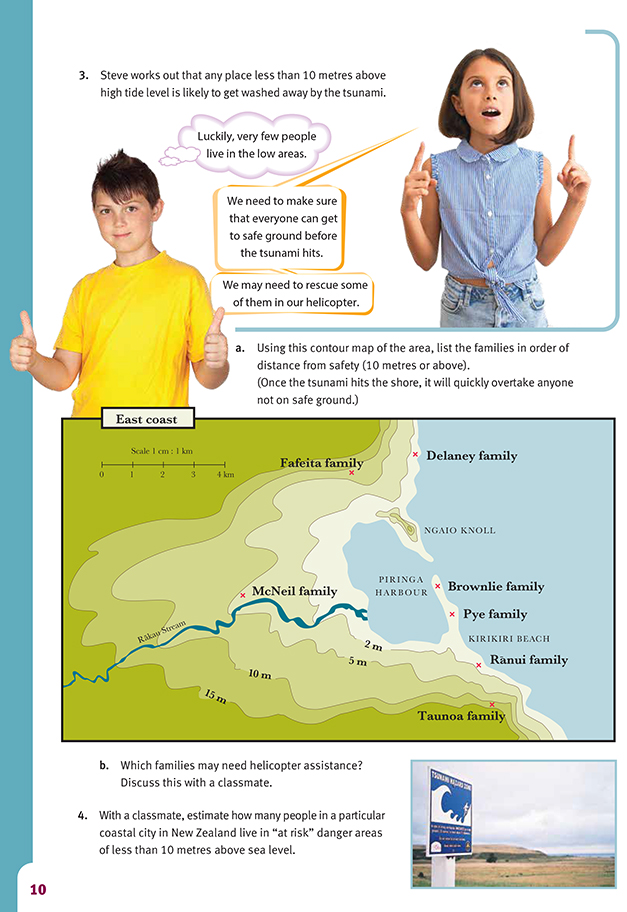
Returning to the original problem, in question 3, the students are asked to create an evacuation plan for the region. One strategy is:
i. For each of the seven places with people:
• identify the nearest point that is above 10 metres
• measure the distance to that point
• decide who can get to that high ground without assistance in the time available.
ii. For those needing helicopter assistance:
• Who should be evacuated first?
• Where should they be taken (to the closest high ground)?
You may need to put a limit on the capacity of the helicopter.
For more background information and a stunning collection of photographs, visit The Pacific Tsunami Museum website at www.tsunami.org. Another site, www.geophys.washington.edu/tsunami, has an excellent computergenerated
animation of a tsunami as it travels across the oceans.
Cross-curricular links
Social Studies and Health and Education
The students could investigate and then list the physical, cultural, and emotional reasons for living in a particular location. Ask them to critically analyse, using a continuum, which points they consider to be of greatest significance. They then could design the ideal place to live that meets the needs of a specified family unit.
Achievement Objectives
Social Studies
• demonstrate knowledge and understandings of why and how people find out about places and environments (Place and Environment, level 4)
Health and Physical Education
• access and use information to make and action safe choices in a range of contexts (Personal Health and Physical Development, level 4)
Science
The students could investigate the impact of tsunamis on land formation and erosion.
Achievement Objective
• investigate and describe processes which change the Earth’s surface over time at local and global levels
(Planet Earth and Beyond, level 5)
Answers to Activity
1. It will slow down because the depth of the ocean is decreasing, and so the formula value will decrease. Tsunamis slow down but increase in height as the water gets shallower close to shore.
2. 2 746 s, which is 45 min 46 s Your distances and times may vary slightly, but your
table should be similar to this:
3. a. A possible order for the minimum distance to safe land could be:
Brownlie family 3.5 km
Pye family 2.6 km
McNeil family 1.6 km
Delaney family 1.2 km
Rànui family 1.0 km
Fafeita family 0.2 km
Taunoa family safe
Note that these are only approximate distances.
The families would try to reach further than the minimum distance if they had time.
b. Discussion will vary. The Brownlie and Pye families are most likely to need helicopter assistance because they may not have enough time to get to safe ground after they get the tsunami warning. Other families in the area should be able to walk to safe ground in the time available.
4. Answers will vary. Many highly populated areas are below the 10 m contour. These include central Wellington, much of Napier and Gisborne, and Christchurch.