This is a level 4 measurement activity from the Figure it Out series.
A PDF of the student activity is included.

Click on the image to enlarge it. Click again to close. Download PDF (540 KB)
interpret temperature charts
TV or newspapers
FIO, Level 3-4, Measurement, The Heat is On, pages 16-17
classmate
This activity uses a common query about local temperatures as a context for measuring temperature.
Discuss the possible factors that cause the temperature to vary in different locations. Exposure to sun and wind, altitude, and proximity to water, vegetation, or concrete surroundings can cause quite different temperatures even though the locations may be quite near each other. This leads into the idea of microclimates. The students could investigate the microclimates within the school grounds by measuring the temperature at different places at the same time on the same day. Have them predict the temperature based on observations of the site before measuring.
In order to make comparisons as seasons change, a town’s temperature is usually measured at a consistent time and place, such as the airport or town hall.
Giving one temperature for each day, always measured at the same time and place, may not suit some people living in the town. Discuss with the students why some people may like to know the highest or lowest possible temperature for their town or some other town. They could also discuss some of the other temperature information given in some newspapers, for example, soil temperature, and who might use this information.
Answers to Activity
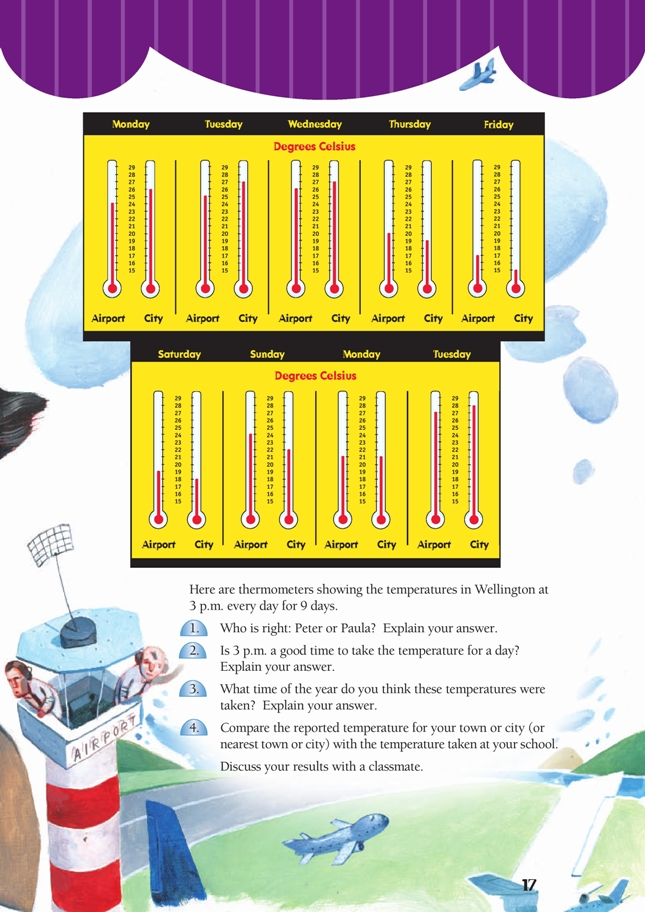
1. Neither is right. Overall, temperatures for the 9 days at both places add up to 203°, an average of 22.6°C. On four of the days, the airport temperature is slightly higher than the city temperature. On another 4 days, the city temperature is higher than the airport temperature, and on the remaining day, the temperatures are the same.
2. Discussion will vary and may include the impact of daylight saving, the way temperature increases and decreases during the day, and the way this is
different in winter and in summer.
3. Summer. Temperatures in Wellington rarely reach 25°C at other times of the year.
4. Practical activity