A PDF of the student activity is included.
Click on the image to enlarge it. Click again to close. Download PDF (608 KB)
explore enlargements
graph paper
ruler
FIO, Level 3-4, Measurement, Growing in Water, pages 18-19
classmate
There is something a little magical about the way these toys can grow so dramatically in water. Find out if anyone in the class has done this with similar toys at home. Discuss their findings. (For example, they may have found that the toys distorted as they enlarged.)
This activity focuses on the change in length. Discuss whether this is the only way to measure a change in size. This discussion will be important in evaluating the manufacturer’s claim for sixfold growth in question 5 because they are likely to be claiming an increase in volume, not length.
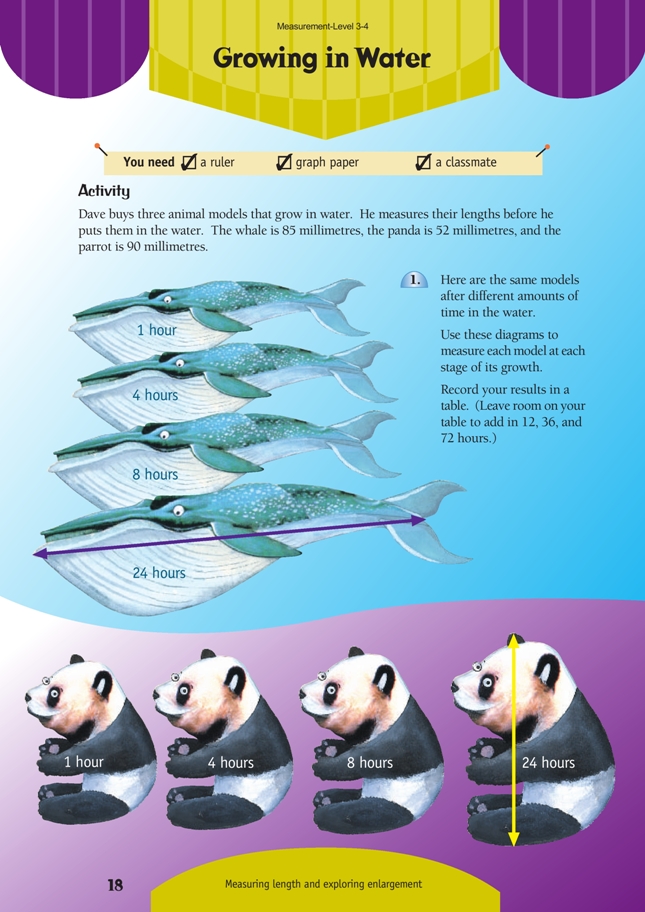
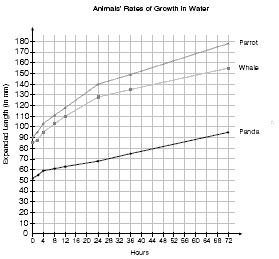
The students need to use given data to estimate unknown lengths. As explained in the students’ book, there is no definite pattern in the growth of the animals, so a graph is the best way to estimate the unknown lengths. The students should not try to find an algebraic rule for the growth patterns. For example, the estimate for 36 hours is not found by multiplying the length at 12 hours by three.
Discuss with the students what scale they will use for the axes of their graphs before they begin because the axis for animal lengths will be quite long and they need to be sure it will fit on their page. If they use a scale of 10 millimetres : 4 hours for the time on the x axis (the horizontal axis), the axis will be about 190 millimetres long (allowing for extending beyond the last figure required). They could use a scale of 10 millimetres : 10 millimetres growth for the animal length on the y axis (the vertical axis), which will make this axis also about 190 millimetres long. These axes will fit on an A4 page.
As the students begin to graph the data, make sure that they realise that the times given are not at regular intervals and that they mark the lengths at the correct points on the graphs.
When the students have completed their graphs, they can interpolate (work within the data set) from the graph to estimate the animal lengths at 12 and 36 hours. For example, to estimate the length of the parrot at 12 hours, they will draw a vertical line up from the 12 hour point on the x axis until it meets the line on the graph. Then they will draw a horizontal line from the point above 12 hours on the line of the graph across to the y axis. The point at which the line hits the y axis is the length of the parrot.
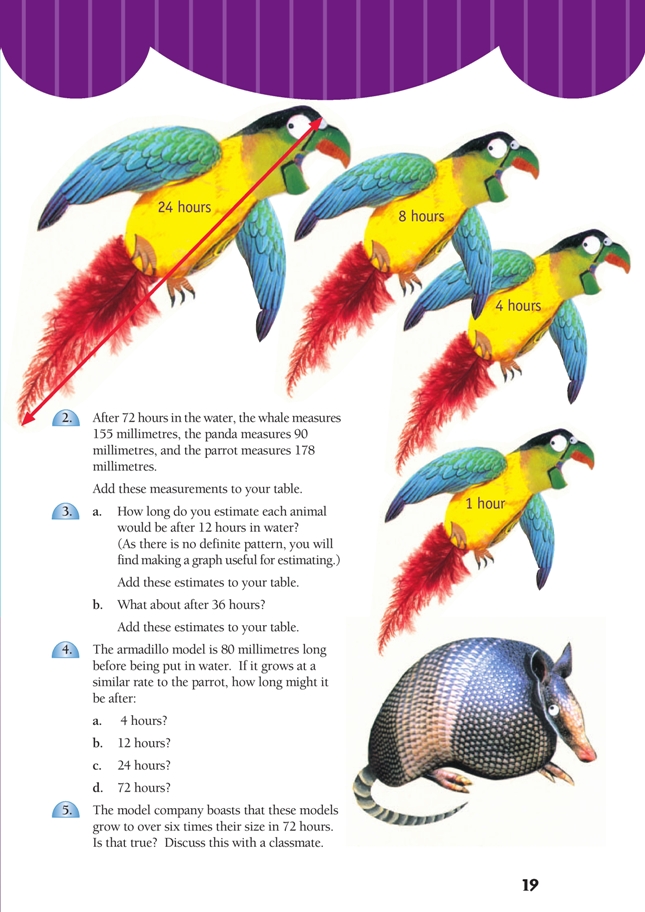
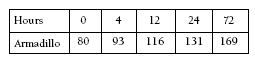
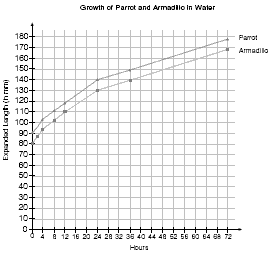
In question 4, the students will need to begin the armadillo graph at 80 millimetres and draw its growth line parallel to that of the parrot. (See the graph in the Answers.) It would be too complex to try to calculate a fraction to show the rate of growth at each of the time stages. After they have drawn the line, the students could use a ruler to help them read off the lengths after 4, 12, 24, and 72 hours.
The students also interpolate from given data in the activity on page 19, Algebra, Figure It Out, Levels 3–4.
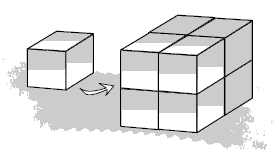
Question 5 highlights the fact that changes in size can be measured in more dimensions than just length. These objects expand in all directions at once, and so they grow in volume more than in length. The manufacturers are correct because a small increase in length may correspond to a large increase in volume.
You could demonstrate this to the students with multilink cubes. If you double the length of all the sides of one cube, you increase the volume eight times.
Answers to Activity
Note: your answers could vary by + or – 1 mm.
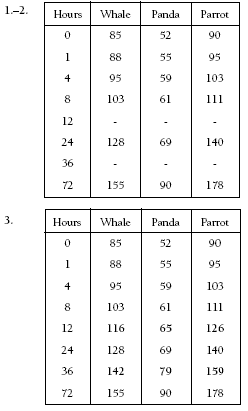
A graph of the three animals, with definite and estimated times, could look like this:
4. Note that the answers in bold are estimates only (based on the parrot pattern).
These lengths could be worked out on a graph like this:
5. Yes. The company’s claims are based on the volume (size) increasing by six. A small increase in length may correspond to a large increase in volume. If you have experimented with objects that grow in water, you will probably have found
that they do grow to over six times their size (volume).