This is a level 5 number activity from the Figure It Out series. It relates to Stage 8 of the Number Framework.
A PDF of the student activity is included.
Click on the image to enlarge it. Click again to close. Download PDF (1159 KB)
calculate speeds
compare the position of object moving at different rates
Number Framework Links
Use this activity to help students:
• consolidate and apply a range of multiplicative strategies (stage 7)
• solve problems with the use of fractions, proportions, and ratios (stages 7 and 8).
Square grid paper or a computer spreadsheet
FIO, Level 3+, Proportional Reasoning, The Great Race, pages 22-23
2 classmates
Like the previous activity, this one requires students to compare the progress of two objects (this time, cars) moving at different speeds. It is more straightforward in that the race takes place on a straight track but more complex in that each car stops and starts for various periods and one changes speed part-way through.
Because there are quite a few details to absorb, students need to make sure that they read the information carefully and interpret it correctly. One way of making sure that they do this is to put them in groups of three as for question 2 and have them read the activity through and then recount the details to each other without referring to the book. Other members of the group can then ask questions (especially about meaning), supply missing details, and correct errors. At the end, every detail is cross-checked against the book, and the group is ready to go. Alternatively, you may want
to get everyone together for a final sharing and briefing.
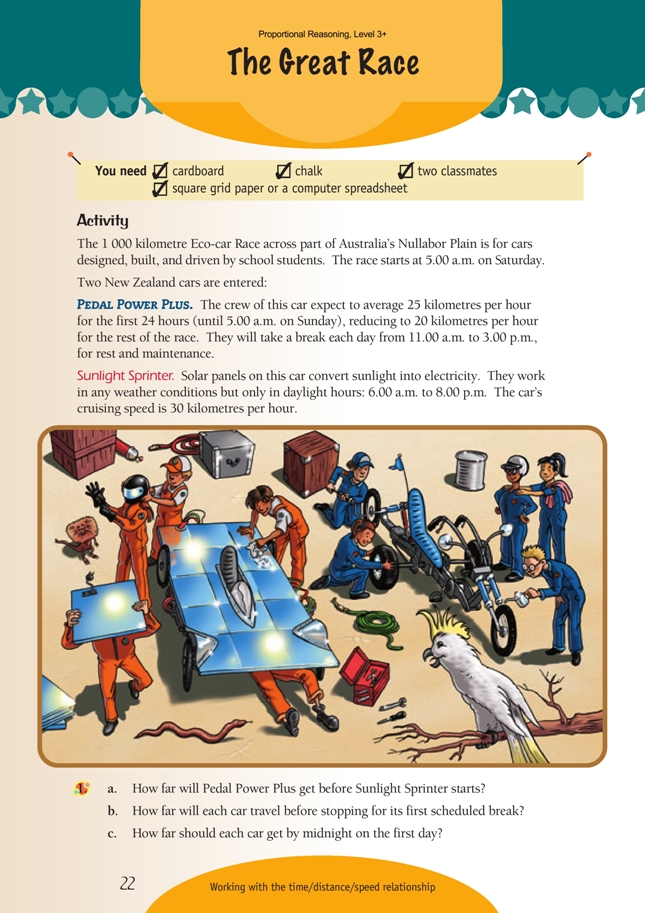
The race starts at 5:00 a.m., but Sunlight Sprinter (SS) only operates from 6:00 a.m., so Pedal Power Plus (PPP) is able to get a 1 hour head start. As PPP travels 25 km in 1 hour, the answer to question 1a is 25 km.
Questions 1b and 1c require students to work out how many hours each car spends travelling and to multiply these by the number of kilometres they cover each hour. Students should not use calculators for these calculations.
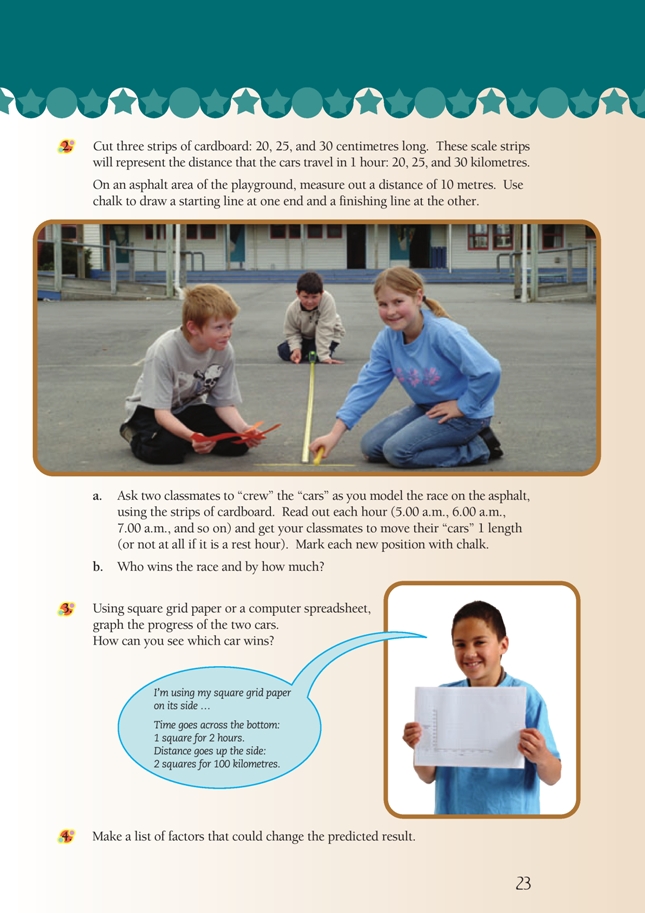
Question 2a is a practical activity in which students model the race on a scaled-down track chalked on the school asphalt. The scale suggested is 1 cm to 1 km (1 : 100 000), which means that each group of students needs to measure and mark a track that is 1 000 cm (10 m) in length. A straight line will do for the track, with a start line at one end and a finish line at the other, like this:
![]()
Given that the the two cars finish very close together, it is important that the 10 m is measured accurately.
Each group needs to cut out three strips of card as described in the student book. As for the track, their lengths need to be measured accurately. (The width doesn’t matter.) The strips represent the scale distance that the cars will travel in 1 hour. Two are needed for PPP because it travels at one speed for the first part of the race and a slower speed for the second part.
Make sure that your students fully understand the relationship between the cars, the strips, and the length of the track.
The race is controlled by the “time keeper” (one of the three people in each group), who gives the instructions and checks to see that they are followed. The other two members of the group are the “drivers” of the cars. The two cars follow the line that represents the track, one on either side of it.
When the time keeper says “6.00 a.m.”, the driver of PPP lays their 25 km strip on their side of the track, marks off its length with chalk, and writes the time. The driver of SS does nothing, because, as at 6.00 a.m., their car has still not started. When the chalking is finished, the time keeper says “7.00 a.m.”. At that point, the driver of PPP measures off a second 25 km length, marks the distance, and writes the time. At the same time, the driver of SS measures off a 30 km length and marks the distance and time. The chalk marks should now show clearly that, at 7.00 a.m., PPP has travelled 2 x 25 = 50 km and SS has travelled 1 x 30 = 30 km. Here is what the track
should look like 1 hour later, at 8.00 a.m.:
The time keeper needs to keep a close eye on the script to make sure that the cars do not move when they are not meant to: PPP when resting and SS during the hours of darkness. The time keeper will also need to remind the driver of PPP when they need to swap over to the 20 km strip.
The diagram below shows the situation at 4.00 p.m. on the first day. SS is clearly well in the lead. Note how the time is marked for PPP. This car was stationary from 11.00 a.m. to 3.00 p.m., so has travelled only 25 km between 11.00 a.m. and 4.00 p.m.
The students should be able to see clearly from the practical exercise above that PPP wins the race but, due to measuring inaccuracies, it is unlikely that they will be able to say with confidence by how much. So to complete their answer for question 2b, they will need to do some calculations. Each group of three should work on this together and then share their strategies with the wider group.
Many strategies are possible. Most involve breaking the race days into chunks of rest and and travel and keeping running records of both distance and time. For PPP, the reasoning might go: “PPP travels for 19 – 4 = 15 hours on day 1. At 25 km/h, this amounts to 375 km. On day 2, PPP travels 5 hours at 25 km/h, covering 125 km. It then travels 19 – 4 = 15 hours at 20 km/h, covering 300 km. The total distance covered by midnight on day 2 is 375 + 125 + 300 = 800 km. This leaves 200 km to be covered on day 3 at 20 km/h. 200 ÷ 20 = 10 hours. Travelling continuously from
midnight, this means that PPP should cross the finish line at 10.00 a.m.” A similar line of reasoning can be used to show that SS should arrive at 11.20 a.m.
An alternative strategy is to work with totals. “Beginning at 5.00 a.m., PPP travels 24 – 4 = 20 hours at 25 km/h and covers 20 x 25 = 500 km. It will take 500 ÷ 20 = 25 hours to travel the remaining 500 km. So the journey will take 20 + 25 = 45 hours plus 2 x 4 = 8 hours of breaks. That’s 45 + 8 = 53 hours in all. 53 = 2 x 24 + 5, so PPP should arrive 2 days and 5 hours after it started, at 10.00 a.m.” A similar line of reasoning will show that SS travels for 1000 ÷ 30 = 33 1/3 hours and spends 1 + (2 x 10) = 21 hours of darkness doing nothing, so it should finish 33 1/3 + 21 = 54 1/3 hours after starting. 54 1/3 = (2 x 24) + 6 1/3, so SS should finish at 5 + 6 1/3 = 11.20 a.m.
Question 3 provides an excellent opportunity for teaching your students how to draw graphs of continuous data. The speech bubble suggests suitable dimensions for a hand-drawn graph. Alternatively, students can create the graph using a computer spreadsheet and charting program. The final part of the question involves interpreting the picture. Ask your students to “read the picture and tell the story”.
Question 4 asks students to consider the realities of racing and to think about some of the many factors that could influence the outcome.
Answers to Activity
1. a. 25 km
b. Pedal Power Plus travels 150 km. Sunlight Sprinter travels 420 km. (PPP’s first
scheduled stop is at 11.00 a.m., which means that it has travelled for 6 hrs, covering
25 km each hr. SS starts at 6.00 a.m. and doesn’t stop until 8.00 p.m., 14 hrs later.
14 x 30 = 420 km)
c. PPP will travel 375 km (15 x 25 = 375). SS will travel 420 km. (See answer to
question 1b above.)
2. a. Practical activity
b. PPP wins, by 1 hr and 20 min. (PPP arrives at 10.00 a.m. on Monday. SS arrives
at 11.20 a.m.)
3. Graphs will vary in the way they are presented. Here is a suitable graph drawn using a computer spreadsheet program. You can tell which car wins by looking at where the two lines meet the 1 000 km line up in the top-right corner. The
PPP line meets the 1 000 km line first, showing that it is the winner.
4. Answers will vary. Possible factors include mechanical problems, sickness or injury, accidents, weather conditions, road/track conditions.