This is a level 3 algebra strand link activity from the Figure It Out series.
Click on the image to enlarge it. Click again to close. Download PDF (253 KB)
interpret relationships from a graph
pattern blocks (optional)
graph paper
FIO, Link, Algebra, Book One, Graphic Details, pages 22-23
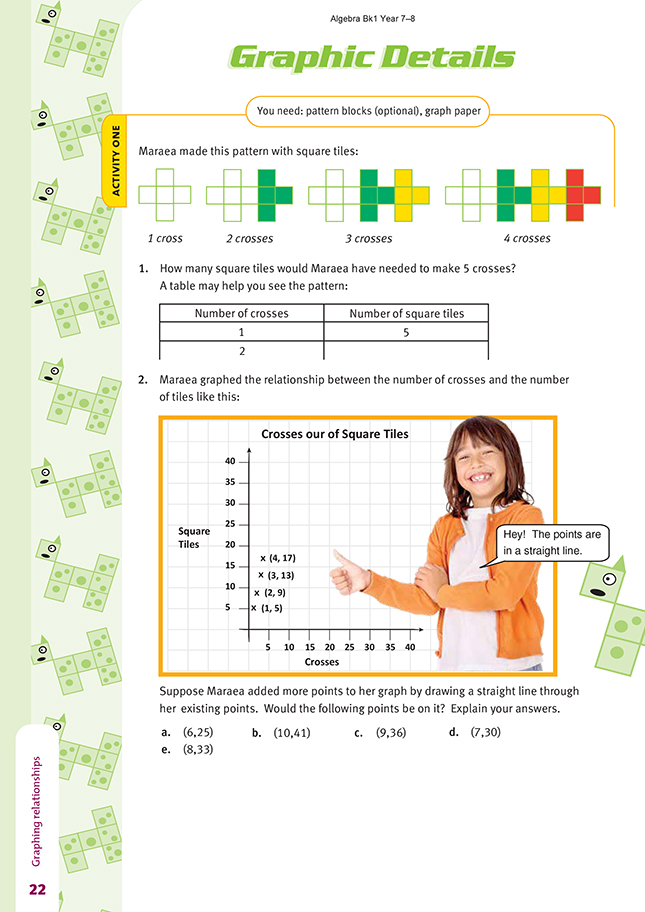
Activity One
In this activity, the students record in a table the data taken from the tile designs and then draw a graph to illustrate any patterns in the data. If the students have not encountered co-ordinates already, you will need to take the time to introduce the concept of co-ordinate pairs (ordered pairs), how to write them, and how to graph and interpret them. The two key principles to emphasise are:
i.the order of the numbers within the brackets matters
ii.when plotting the point on a graph, the first number defines horizontal movement from the origin and the second number defines vertical movement.
Each point on the graph has a pair of co-ordinates representing the data in the table. The points lie on a straight line, so the algebraic relationship for the pattern is called a linear relationship.
Graphing ordered pairs is particularly useful when it comes to seeing patterns. If there is a rule connecting the first and second number in each pair, this will show up as an obvious line, curve, series of lines, or area. In order to predict if the points (6,25), (10,41), (9,36), (7,30), and (8,33) lie on the line, some students may choose to extend the line on the graph. This is an appropriate approach, but such students will need to be very accurate in their sketching. For example, although the points (9,36) and (7,30) are not on the line, the points (9,37) and (7,29) are, and the difference may be difficult to read. A generous-sized graph, for example, with a scale limited to 12 on the horizontal scale and 45 on the vertical scale, would assist students who use
this method. Students who approach this question algebraically will need to test each pair of co-ordinates using the following relationship for the pattern: the number of tiles is equivalent to the number of crosses times 4 plus 1.
So, for example, the design below with 2 crosses has 2 x 4 + 1 = 9 tiles, and the design with 3 crosses has 3 x 4 + 1 = 13 tiles.
A similar design with 9 crosses has 9 x 4 + 1 = 37 tiles. So the point (9,37) lies on the line, but, as mentioned above, (9,36) does not lie on the line. Similarly, the point (7,29) lies on the line, but (7,30) does not. The students may express this linear relationship algebraically. For x crosses, there are y tiles where y = x x 4 + 1, or 4x + 1. When x = 1 000, then y = 4 x 1 000 + 1, or 4 001. This means that 1 000 crosses will require 4 001 tiles.
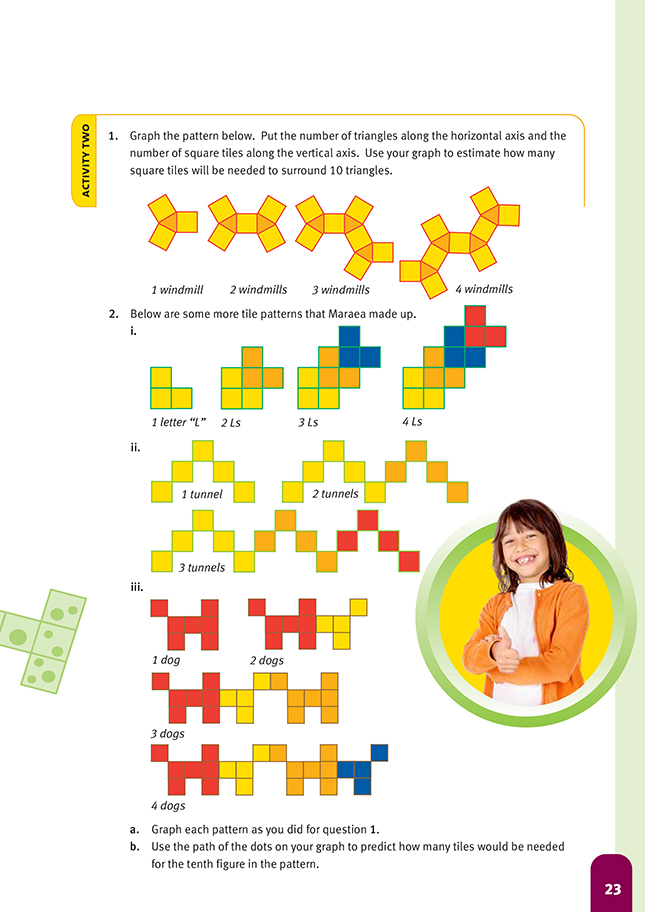
Activity Two
In this activity, students collect data from the tile designs. They record the data in a table to help identify the co-ordinates for points on the graphs illustrating the rules for the patterns of tiles in the designs.
In question 1, the students collect and record the data for the designs. They use their graph to find the number of square tiles (21) for a design with 10 triangle tiles. The table below shows the pattern leading to the rule for the linear relationship.
The rule for the pattern is: the number of square tiles is 2 times the number of triangle tiles plus 1. Algebraically, this is y = 2x + 1, where x stands for the number of triangle tiles and y stands for the number of square tiles.
The tables of data and rules for the designs in question 2 are as follows:
i.
The rule for the pattern is: the number of tiles is 3 times the number of Ls. Algebraically, this is y = 3x, where x stands for the number of Ls and y stands for the number of tiles.
ii.
The rule for the pattern is: the number of tiles is 4 times the number of tunnels plus 1. Algebraically, this is y = 4x + 1, where x stands for the number of tunnels and y stands for the number of tiles.
iii.
It is not possible to draw a straight line through the points in the table above, so there is no linear rule for the pattern. The following table shows how the number of tiles for successive designs in the pattern increases by 4, then 7, then 4, then 7, and so on.
Using this pattern gives the sequence for the number of tiles as 7, 11, 18, 22, 29, 33, 40, 44, 51, 55, … The tenth number is 55. The alternating increments of 4 then 7 occur because the dog designs are alternately tail to tail and head to head. When they are tail to tail, the tail and hind legs of one dog are also the tail and hind legs of the next dog. Three tiles are shared in this way. When they are head to head, no tiles are shared with the next dog.
Answers to Activities
Activity One
1. 21 tiles. The completed table would look like this:
.gif)
2. a. Yes.
b. Yes.
c. No.
d. No.
e. Yes.
Explanation: The number of tiles is the same as 4 times the number of crosses plus 1. If the second co-ordinate does not fit this rule (second number = first number x 4 + 1), then the point will not be on the same straight line as the other points.
Activity Two
1. If you make a table like this before you do your graph, it might look like this:
![]()
A graph for this is:
So 21 squares will be needed to surround 10 triangles.
(A rule for this could be expressed as: the number of squares equals 2 times the number of triangles plus 1. This can be written as s = 2t + 1.)
2. a. i.
b. i. 30
ii. 41
iii. 55