This is a level 2 algebra activity from the Figure It Out theme series.
A PDF of the student activity is included.
Click on the image to enlarge it. Click again to close. Download PDF (275 KB)
continue a sequential pattern
write a rule to describe a sequential pattern
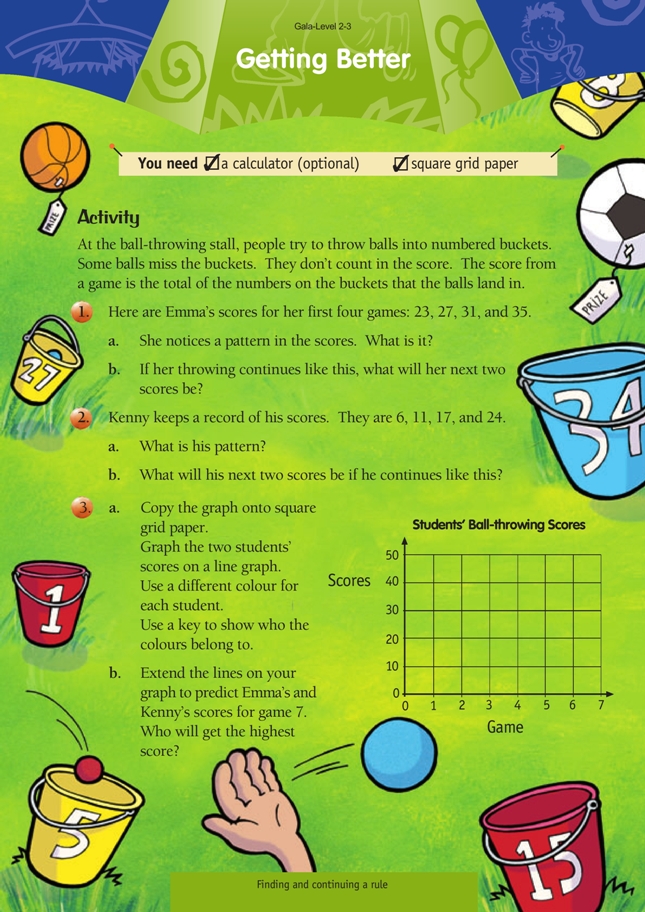
FIO, Level 2-3, Theme: Gala, Getting Better, page 15
Square grid paper
This activity requires students to continue a pattern, first by observation and secondly by plotting a relationship onto a linear graph to make a prediction. Some students will spot the patterns quite quickly. Nevertheless, they will still need to organise the information to accurately plot the ordered pairs onto a number plane for question 3.
Organising data in a table is a useful way to find and describe patterns.
Encourage the students to explain the patterns in their own words, for example, “going up by four each game”, “going up by one more each time”, and so on.
The students can use the tables for questions 1 and 2 to list ordered pairs for question 3:
• (1, 23), (2, 27), (3, 31), (4, 35), (5, 39), (6, 43)
• (1, 6), (2, 11), (3, 17), (4, 24), (5, 32), (6, 41)
This will enable the students to plot the relationship between the two variables, games and scores, onto a linear graph. You will need to emphasise the importance of accuracy in plotting the points, otherwise the students won’t be able to draw an accurate line. The students should draw graphs that are bigger than the one shown in the students’ book. Larger squares make it easier to plot accurately. Make sure you also emphasise that the students put the game (the independent variable)
on the horizontal axis and the score (the dependent variable) on the vertical axis.
In question 3b, future predictions can be made by extending the line a stage further and reading the corresponding dependent variable for game seven. Providing the line was drawn accurately, the prediction will also be accurate. Highlight and discuss with the students the comparison between the tables and their numeric prediction and the prediction on the graph.
As an extension, you could ask the students to compare their graph with a reducing pattern or an unpredictable score. For example:
• Ask them a question with scores that decrease at a constant rate (for example, four less each time). How does this change on the linear graph?
• Ask them a question with random scores showing no pattern. How will this appear on the graph?
• Ask them to discuss how Te Rata School could be sure to make a profit on this game. They will need to decide or find out:
– what the players need to do to win a prize (do they need to reach a certain score,
or will they be the players with the highest scores at the end of the day?)
– how much the prizes cost
– how much they should charge people to play.
Answers to Activity
1. a. The scores improve by 4 each time (+ 4).
b. 39, 43
2. a. The number added increases by 1
each time (+ 5, + 6, + 7).
b. 32, 41
3. a. Students’ Ball-throwing Scores
b. Students’ Ball-throwing Scores
Kenny, with a predicted score of 51