This is a level 3 and 4 statistics activity from the Figure It Out series.
A PDF of the student activity is included.
Click on the image to enlarge it. Click again to close. Download PDF (1515 KB)
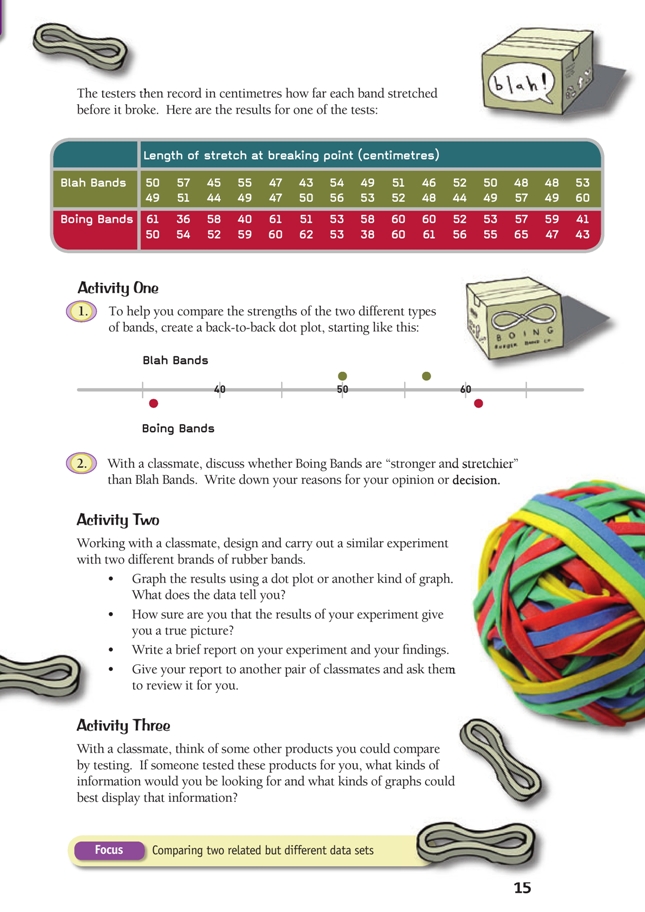
create a back-to-back dot plot
make a conclusionn from the data
conduct an investigation and graph the results
This diagram shows the areas of Statistics involved in this activity.
The bottom half of the diagram represents the 5 stages of the PPDAC (Problem, Plan, Data, Analysis, Conclusion) statistics investigation cycle.
FIO, Levels 3-4, Statistics Revised Edition, Fully Stretched, pages 14-15
Classmates
In these activities, the students analyse the results of an experiment designed to test the relative strengths of two kinds of rubber band.
Activity One
Question 1 involves creating a back-to-back dot plot.
Question 2 involves comparing the two distributions and relating this information to the rubber band scenario. When comparing the distributions, students should consider:
• spread
• maximum and minimum values
• clusters
• medians
• outliers (for the more able students).
The students should base their conclusions about the rubber bands on this analysis. Encourage them to use words and phrases such as “reliable”, “more consistent”, “variable”, and so on, backing all their statements with reference to the dot plots.
After they have reached their conclusions, a whole-class discussion could be a valuable means of giving students feedback on the quality of their thinking.
Activity Two
This activity involves setting up an experiment that is best undertaken in pairs or small groups. It should follow all five steps of the PPDAC. It could conveniently be linked with the technology curriculum. With careful planning, it could provide a rich learning experience.
Some thought needs to be given as to what your role will be in terms of giving advice and providing resources. Ideally, the students will be given maximum independence. If so, they may come up with very different approaches to the problem. You are obviously responsible for setting up an environment in which genuine experimentation is encouraged, but dangerous or foolish conduct is a no-no.
The activity calls for the students to write a brief report. This report should cover:
• the reason for the research
• the methodology
• the results
• an analysis of the results
• notes on any problems encountered
• a comment on the validity of the results
• a final conclusion
• reflection (for more advanced students).
The depth of this report will vary considerably from group to group, depending on the depth of understanding and the literacy skills available in the group.
Activity Three
This broadly-defi ned activity invites students to generalise from the experience they have gained in Activity Two.
Answers to Activities
Activity One
1.
2. Conclusions may vary, but the back-to-back dot plot does show that fewer Boing Bands broke before 50 cm and 5 of them stretched further than any Blah Bands. Half the Blah Bands broke before they stretched to 50 cm, while half the Boing Bands lasted until 55 cm. However, four Boing Bands broke sooner than any of the Blah Bands, so Boing Bands don’t reliably last longer than Blah Bands.
Activity Two
Experiments, results, and reports will vary.
Activity Three
Suggestions and comments will vary, depending on the products.
Key Competencies
Fully Stretched can be used to develop these key competencies:
• using language, symbols, and texts
• participating and contributing.