This is a level (3+ to 4+) mathematics in science contexts activity from the Figure It Out series.
A PDF of the student activity is included.
Click on the image to enlarge it. Click again to close. Download PDF (1468 KB)
Students will:
- measure and record data on temperature change
- convert between temperature change and food energy units
- calculate the total energy needs and intake for sample menus, using food energy unit values
- investigate the relative proportions of energy provided by different foods in their diet.
Students should discover that:
- sugars tend to have a high energy density (make up a large portion of energy intake by mass of food consumed).
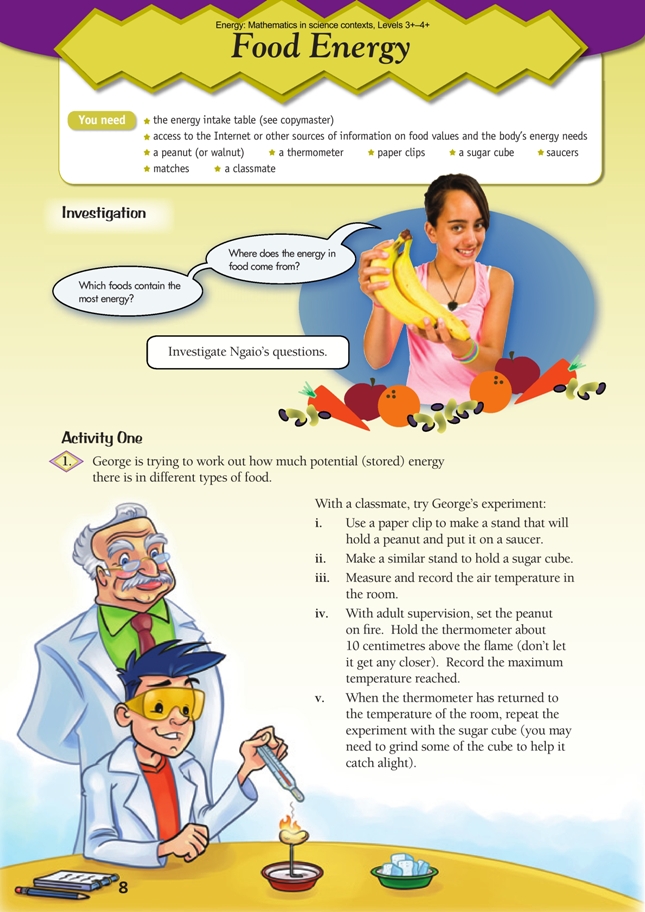
a peanut (or walnut)
a thermometer
paper clips
a sugar cube
access to the Internet or other sources of information on food values and the body's energy needs
the energy intake table (see copymaster)
matches
a classmate
FIO, Energy, Levels 3+-4+, Food Energy, pages 8 - 9
Preparation and points to note
Some children have serious allergies to nuts and food products, so you need to check this out for your class and exercise caution. Good substitutes for the peanuts are potato chips, banana chips (dried), or crackers.
As with any experiment involving potentially dangerous equipment, start by setting safety expectations and reviewing emergency procedures. For Activity One, set up the apparatus carefully and safely, as shown in the illustration in the students’ book. The students should wear safety glasses when carrying out the experiment. The bulb of the thermometer will get hot; students should not touch it during or immediately after the experiment.
Instead of measuring the temperature directly above the burning peanut or sugar cube, the students could suspend a tin (a good conductor of heat) containing 100 mL of water securely over the burning food and then use the thermometer to measure the temperature rise of the water. To find the exact energy* given off by the burning food, they would need to multiply the temperature rise by 4.2 (specific heat of water).
In these activities, students need to make sense of information, draw on their own experiences, and debate their ideas, all of which use and further develop the key competency thinking.
Points of entry: Mathematics
These activities have three mathematical components: measuring temperature change, converting temperature change to energy in joules (J), and adding up food energy values to reach an appropriate daily intake target.
Confirm that the students know how to safely use and read your particular model of thermometer. Remind them that, like the bungy jump stretch on page 6, they are trying to find the amount of change, not the overall value.
Measurements should be consistent; for example, have the students mark a reference point for the height of the thermometer. Encourage them to think about the surrounding temperature and its impact on their measurements. They need to wait for the thermometer to return to the ambient (room) temperature before burning the second food and, if they are heating water instead of air, they need to change the water.
Consider the different variables involved in this experiment. The two foods will probably have different masses and volumes, the food may not all burn, the foods will burn at different rates, and the thermometer may not measure all the energy of the burned food.
Challenge the students to factor these variables into their energy calculations, for example, by estimating the total energy change in relation to the volume of the food burned. If only half the sugar cube burns, then the total amount of energy in the cube is, at minimum, twice the amount recorded by the thermometer. For more precise results, consider asking the students to measure the mass of the food samples before and after burning and use the mass difference in their calculation and/or give each group food samples of approximately the same size.
The thermometer cannot accurately measure energy change (due to heat loss into the surrounding atmosphere and variance in the combustion of the foods), so have the students use Activity One, question 2c, to estimate measurement error and calibrate their answers. A typical peanut, if burned completely, releases kilojoules [kJ] of energy that equal a 20°C air temperature change. (1 g of potato or banana chips also contains about 20 kJ of energy.) If the experimental peanut increases the air temperature by 5°C, then the measured energy value is only 1/4 of the actual. If the sugar cube and the peanut burn in a similar way, the students should then multiply by 4 to get the real amount of energy in the sugar cube.
Encourage the students to repeat their experiments using the same foods and to work out the average temperature rise for each type. The results from different groups could then be collated on a spreadsheet, from which comparisons could be made and conclusions drawn.
As an extension, give the students different-sized samples of the same foods and ask them to find out if the temperature rises more for larger samples.
For Activity Two, students should find the amount of energy per serving (from nutrition labels, a photocopied table of food energy values, or an appropriate website), multiply these by the number of servings they expect to eat per day, and add up the subtotals to get a total daily intake. Alternatively, they can use size of serving (in grams) together with kJ per 100 g data. They may find it useful to structure their calculations using a table.
Points of entry: Science
These activities should help students make the link between energy (as measured by heat), food, and eating. Check that they understand that we get energy from food and then convert that energy into kinetic energy with our muscles. Activity requires more energy; energy without activity stores potential energy in our bodies as fat.
Like other forms of energy, food energy is expressed in joules (1 kJ is simply 1 000 J). Students may come across the term calorie, which is a non-SI unit for food energy. The kilojoule is the unit officially recognised by the World Health Organisation (1 kcal = 4.1868 kJ).
Ask the students to present the results of their investigations. Many facts about food energy are surprising. Only about 85% of the total energy in food is available to humans because 15% is lost in the digestive process and other bodily functions. Certain types of food contain more food energy per gram than others. Fats have particularly high energy density (energy per gram), while sugars and proteins have less. Water, nondigestible fibre, minerals, and vitamins are essential for a healthy diet but do not contribute to energy values.
Possible discussion questions include: Why does the body need energy, and where do we get it from? What does it mean when we say we don’t have any energy? What is energy used for, and how does it get used up? When discussing “Where does the energy in food come from?”, look at the relationship between the transfer of energy through the food chain and the Sun’s role as the ultimate source of most of our food energy.
Discuss the importance of a healthy diet. Ask What are the ingredients of a healthy diet? We need vitamins for health and fitness, fats for stored energy, proteins for cell growth and development, carbohydrates for quick energy in the form of glucose, and roughage (fibre), to help keep the body system operating properly (like oil in a car engine).
A useful table of food energy values can be found at:
www.hc-sc.gc.ca/fn-an/alt_formats/hpfb-dgpsa/pdf/nutrition/nvscf-vnqau-eng.pdf
Answers
Investigation
Answers will vary. Ultimately, the energy in food comes from the Sun. Photosynthetic plants use the
radiation from the Sun to make sugars. We take in this energy either by eating plants and/or their fruit or eating animals that feed on those plants.
The amount of energy in food varies widely. In general, fats provide more energy for a given amount
of food than do proteins or carbohydrates. Examples of healthy, high-energy, high-density foods include peanut butter and dried fruits.
Activity One
1. Practical activity
2. a. Approximate the energy calculation using the conversion factor 1°C air temperature change
= 1 kJ. For example, if burning half the sugar cube raised the air temperature by 8°C, then half the sugar cube has approximately 8 kJ of energy. The whole cube would therefore have 16 kJ.
b. The heat generated from the energy did not all migrate to where you had the thermometer bulb; it was lost in all directions. Some would have also gone into heating the stand.
c. Answers will depend on the peanut calculation in 2a. Compare your peanut energy calculations with the 20 kJ per peanut figure and then multiply the sugar cube energy by the same factor. For example, if you calculated that a whole peanut has 10 kJ, this means that your calculation for the peanut was too low by half. You should therefore double the amount of energy you calculated for sugar as well.
Activity Two
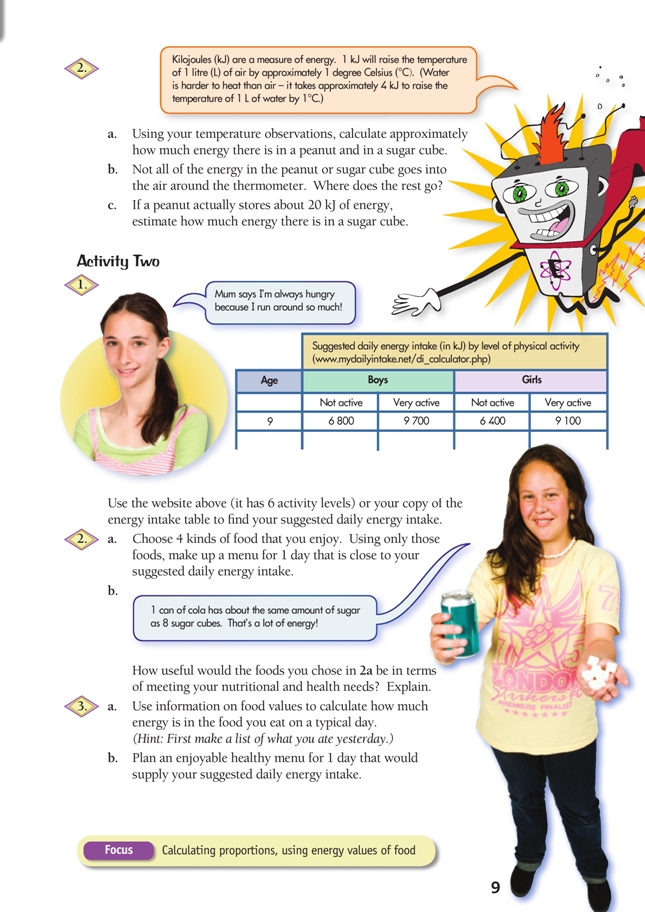
1. Suggested daily energy intakes will vary depending on your age and level of activity.
2. a.–b. Menus and comments on usefulness will vary. Hopefully you will have aimed for an overall healthy menu rather than just highenergy foods. Two sample 9 050 kJ menus are listed below:
| Menu 1 | |||
| kJ per 100 g | Grams consumed | Total kJ | |
| Bananas | 400 | 400 | 1 600 |
| Wheat bread | 1 040 | 400 | 4 160 |
| Orange juice | 240 | 275 | 660 |
| Peanut butter | 2 630 | 100 | 2 630 |
| Total | 1 175 | 9 050 | |
| Menu 2 | |||
| kJ per 100 g | Grams consumed | Total kJ | |
| Chocolate | 2 400 | 100 | 2 400 |
| Soft drink | 190 | 330 | 627 |
| Potato chips | 1 900 | 275 | 5 225 |
| Bacon | 800 | 100 | 800 |
| Total | 805 | 9 052 | |
Both menus have about the same kilojoules. However, menu 1 is much healthier because fruits and nuts contain more vitamins and minerals than do fats and sugars. In menu 1, you actually eat more food (1 175 g instead of 805 g). If you ate 1 175 g of menu 2, you would eat over 13 000 kJ.
3. a.–b. Energy calculations and menus will vary.