This is a level 3 and 4 statistics activity from the Figure It Out series.
A PDF of the student activity is included.
Click on the image to enlarge it. Click again to close. Download PDF (1343 KB)
construct a hiistogram
use graphs to describe the data
make comments from a trendline
This diagram shows the areas of Statistics involved in this activity.
The bottom half of the diagram represents the 5 stages of the PPDAC (Problem, Plan, Data, Analysis, Conclusion) statistics investigation cycle.
FIO, Levels 3-4, Statistics Revised Edition, Fish Figures, pages 12-13
A classmate
In these activities, which involve measurement data, the students convert stem-and-leaf graphs into histograms, create a scatter plot, and use trendlines to help them make predictions.
Activity One
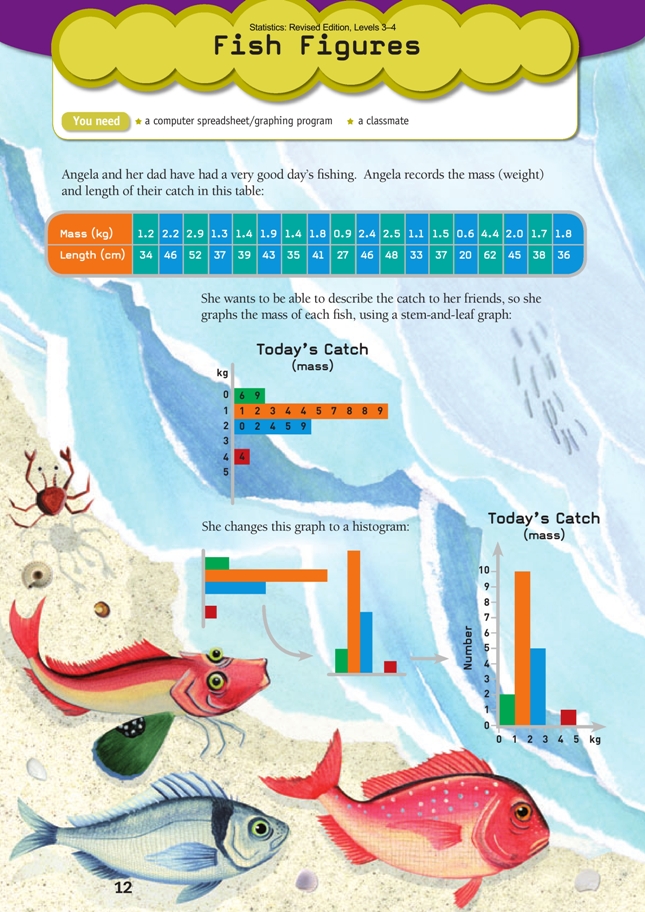
Question 1 is designed to show the relationship between a stem-and-leaf graph and a histogram: rotate the stem-and-leaf graph 90 degrees anticlockwise, adjust the labelling, and there you have it.
This process illustrates an important advantage that a stem-and-leaf graph has over a histogram. In the first, it is possible to see the shape (or distribution) of a data set and still identify individual data values. In the second, the shape of the distribution is just as clear but the individual data values are submerged in the groups (intervals); detail has been lost.
A further advantage of the stem-and-leaf graph is that the data count and the median (and, in larger data sets, the quartiles) can easily be found. The data count cannot be found from a histogram and, for continuous (measurement) data, the median and quartiles can only be estimated.
The students should ensure that the leaves on their stem-and-leaf graph are evenly spaced so that, when it is rotated, it matches the histogram and it is easier to see which intervals have the greatest frequency.
Activity Two
The students need to have access to and an understanding of how to use a computer spreadsheet/ graphing program for this activity (though, for a small data set such as this, a scatter plot can also be drawn by hand reasonably easily).
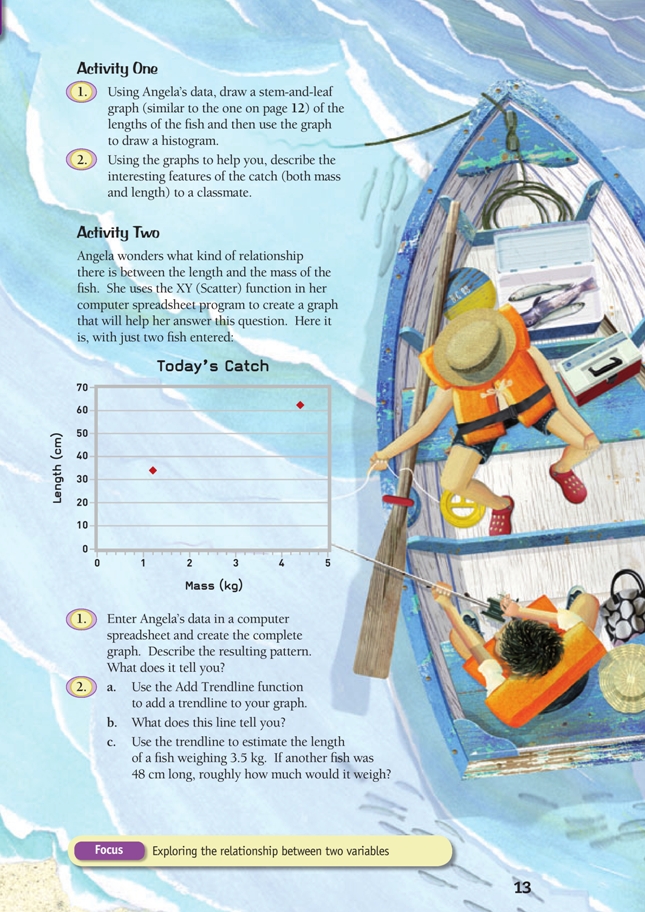
This may be the first time that your students have come across scatter plots. This type of graph (also known as an XY scatter graph) is designed to show what relationship (correlation), if any, exists between two variables (in this case, the mass and length of fi sh). One of the most useful features of a scatter plot is that each individual data value retains its identity – no data whatsoever is lost in the graphing process. This means that the reader can see both the pattern generated by the data as a whole and trace exactly where every individual piece of data (fi sh, person, book, or whatever) has got to.
So that the students have an idea what to expect, page 13 in the students’ book shows an appropriately formatted graph, with two data values in place. (Needless to say, if the graph is created by computer, all the values appear simultaneously. Note that you can add values and update the computer graph at any stage.)
It is clear from the pattern of dots in the completed graph that as the fish gets longer, the mass increases. If there were no such relationship, the dots would be randomly scattered around the graph instead of clustered very obviously along an imaginary line.
Question 2 involves adding a trendline to the graph and then using it to make two predictions. The predicting provides a check that the students understand the meaning of the graph and the relationship it reveals. (You will probably find Add trendline under Chart on the menu bar of your graphing program.)
Answers to Activities
Activity One
1. The stem-and-leaf graph below shows the lengths of the fish caught.
2. Descriptions will vary. For example, most of the fi sh weighed between 1 and 3 kg. Two fish weighed less than 1 kg and one weighed 4.4 kg. Most of the fish were between 30 and 50 cm long. The shortest was 20 cm, and the longest was 62 cm.
Activity Two
1. Your graph should look similar to this (except for the trendline, which has been added here in answer to question 2a):
The pattern shows a definite relationship between length and mass: the longer the length of the fish, the heavier the fish is (within moderate variation); looked at the other way, the heavier the fish, the longer it is.
2. a–b. See the graph in question 1 for the trendline. The trendline should confirm
your answer for question 1.
c. On the basis of the trendline in the graph for question 1, you could expect a fish
weighing 3.5 kg to be between 50 and 60 cm in length; a fish that is 48 cm long
could be expected to weigh between 2.5 and 3 kg.
Key Competencies
Fish Figures can be used to develop these key competencies:
• thinking
• using language, symbols, and texts.