This is a level 3 algebra activity from the Figure It Out theme series.
Click on the image to enlarge it. Click again to close. Download PDF (564 KB)
complete a sequential pattern
show data on a line graph
A classmate
Coloured pens
FIO, Level 3, Theme: Time Travel, Epidemic! pages 20-21
Copymaster of Activity Two table
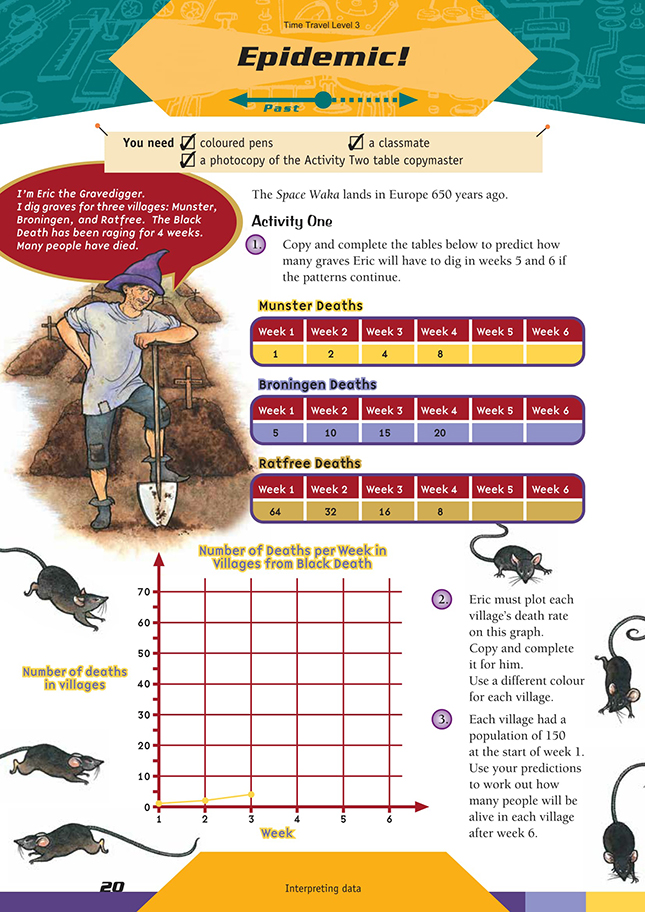
Activity One
The tables should help the students to recognise the pattern of deaths in each town. Students who have difficulty recognising the pattern need to concentrate on working out what has happened to the number of deaths from week 1 to week 2 and then extend this to week 2, week 3, and so on, until they are able to identify a definite pattern. They can then predict the results for weeks 5 and 6. For example:
For this example, multiplying by 2 is the easiest pattern to use.
The patterns of deaths in the villages are examples of exponential growth, constant growth, and exponential decay. (In reality though, an epidemic wouldn’t have a constant growth rate.) The graph for Munster, an increasingly steep curve, illustrates an exponential growth rate, which is the kind of growth often seen at the beginning of an epidemic. The deaths in Broningen are increasing at a constant rate of 5 per week, and the students should be very familiar with this number sequence. The graph of constant growth is a straight line. The deaths in Ratfree are halving each week. The graph for Ratfree, an increasingly shallow curve, is an example of exponential decay.
This is typical of what would be observed at the end of an epidemic. There are many other examples of disease epidemics to be drawn from real life that could be discussed by the class: influenza, AIDs, and so on.
This activity may lead to discussion with more able students about exponential growth and decay. Because constant growth and exponential growth appear similar in the early days, it is difficult to know which pattern of growth is occurring with a disease or a noxious weed until the data set for such a study is quite large. You may like to point this out to the students and discuss with them how important it is not to rely too heavily on small data sets. (See also “The Chain Goes On”, Teachers’ Notes: Connected 3 2001, pages 24–27.)
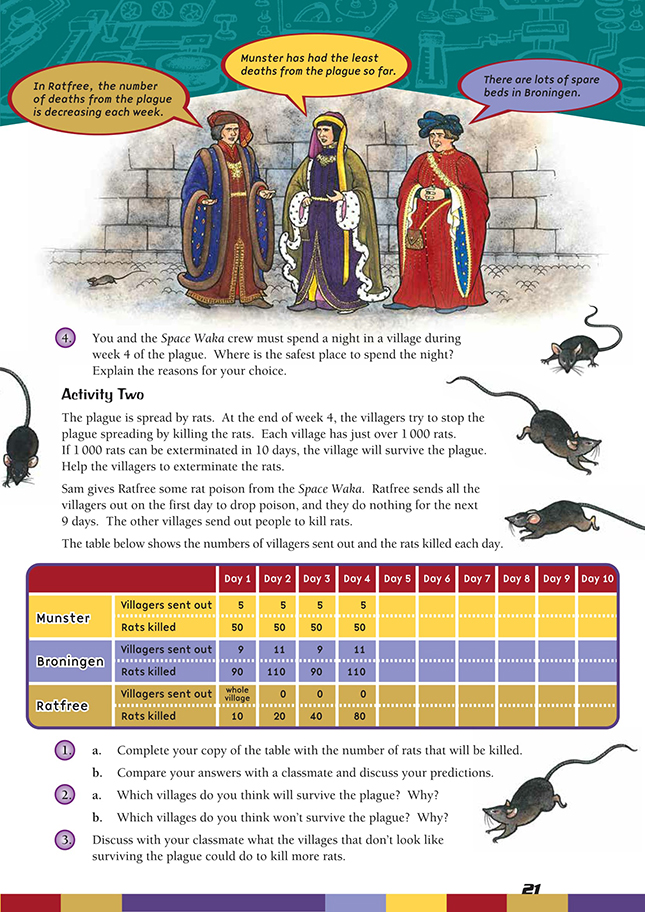
Activity Two
In Activity Two, the students need to identify the number patterns in the table. The patterns are all quite straightforward, with the rats killed in Munster being a constant 50 each day (that is, 10 per villager), the rats killed in Broningen alternating between 90 and 110 (once again, 10 per villager), and the rats killed in Ratfree doubling each day. Remind students that the table shows the number of rats killed each day, so they will need to add up the daily totals to find the total number of rats killed for each village. There are just over 1 000 rats in each village, so once this target is met, there
will be no more rats in that village. (The students may need to adjust the numbers in their table once this target is met.) The students then need to compare these totals with the target of 1 000 rats killed for each village to assess which villages are likely to survive.
Answers to Activities
Activity One
1.
2.
3. There will be 87 people left alive in Munster. There will be 45 people left alive in Broningen. There will be 24 people left alive in Ratfree.
4. Ratfree is the safest place to spend the night because the number of deaths is falling the most rapidly, even though more people have died from the plague so far in Ratfree than in Munster or Broningen.
Activity Two
1. a.
 b. b. Answers will vary.
2. a. Broningen and Ratfree because they have killed at least 1 000 rats in the 10 days
b. Munster because they killed only 500 rats in the 10 days
3. Discussion points will vary but should include the fact that each person kills 10 rats per day. To kill more rats and survive the plague, Munster needs to send more people out to kill rats or get some rat poison.