This is a level (3+ to 4+) mathematics in science contexts activity from the Figure It Out series.
A PDF of the student activity is included.

Click on the image to enlarge it. Click again to close. Download PDF (689 KB)
Students will:
- gather and enter personal lifestyle data
- interpret data displays in order to identify patterns and trends
- change input variables and observe the effect on outputs
- estimate sources of variation in eco-footprints.
Students should discover that:
- outputs are a function of inputs.
a classmate
FIO, Using Resources, Levels 3+-4+, Ecological Footprints, pages 4 - 5
Preparation and points to note
Choose a suitable eco-footprint calculator and, if possible, take the quiz yourself to get a feel for the
data required. Some of the calculators are more interesting than others, and some ask for quite detailed information. Identify what information the students will need before they can calculate their own footprint. Allow the students time to gather this information; they will need to discuss the questions and may need to collect some information from home, for example, the fuel consumption of the family car(s).
In this activity, students need to make sense of information and their own experiences and come up with ideas, so the key competency thinking is applicable.
If your students need practice in interpreting visual data displays, the Figure It Out level 3–4 books on statistics are a good place to find suitable resources.
Support the students to make links between the information required for the ecological calculator and their own impact on the environment. Explore the meanings of carbon footprint, food footprint, and goods and services footprint.
Note that eco-footprint calculators are unlikely to be specific to New Zealand and may not even have New Zealand on the list of selectable countries. If necessary, the students can pick the country or place that is likely to provide the closest match, for example, Australia.
Points of entry: Mathematics
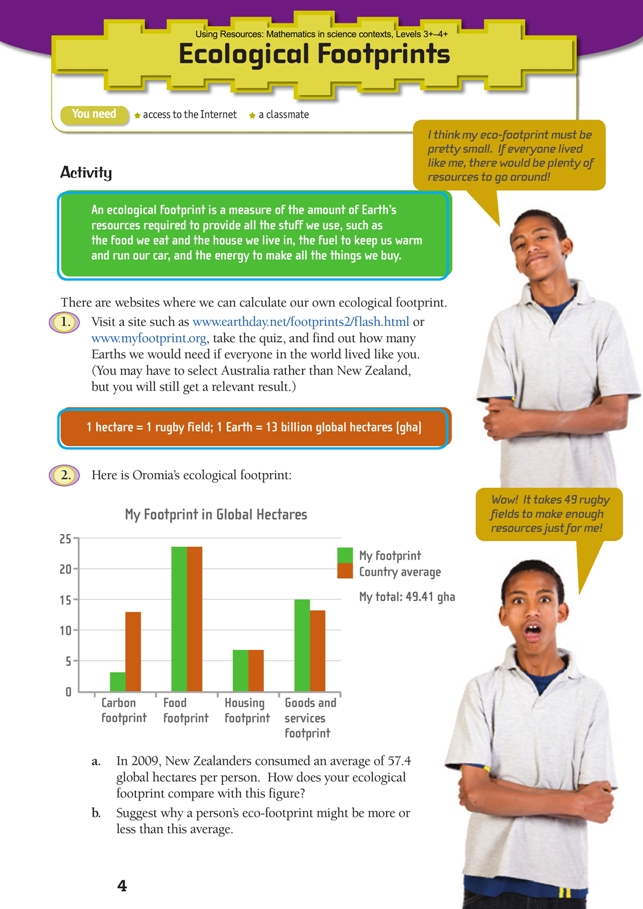
This activity explores 1 idea using 4 different representations: a bar graph, a pie chart, an index (49.41 gha), and a ratio (3.6 Earths if everyone on Earth lived like Adena). The representations on page 5 of the students’ book are an excellent starting point for investigating how personal lifestyle contributes to humankind’s overall eco-footprint.
The students need to understand that pie charts don’t show the size of the “cake” (Adena’s 3.6 Earths pie is the same size as Matthew’s 2 Earths pie), only how it is “carved up” or divided by category. This should lead to discussion as to whether, for example, Matthew is actually using more food than Adena, as appears at first glance (he is using less). A useful activity is to convert the information in the 3 pie charts into a grouped bar chart like Oromia’s on page 4 of the students’ book. To do this, the students will need to use a protractor to measure the angle of each sector (for example, 35º), then multiply this angle over 360º by the number of global hectares represented by the pie (for example, 35/360 x 58.6 = 5.70 gha). By doing this, the students will gain a powerful insight into the meaning of the information in the two kinds of graph.
Carefully unpack the meaning of the unit Earth. The statement “Adena consumes 3.6 Earths” doesn’t mean that she personally consumes 3.6 Earths but that if everyone were to consume resources like her, they would need 3.6 Earths to supply those needs/wants (1 Earth wouldn’t be anywhere near enough). This understanding is important for the next activity, Pareto’s Rule.
What matters more than actual magnitude is that the students have a qualitative understanding of the direction of change so that they can link cause and effect. When they are discussing the various factors that can increase or decrease an eco-footprint, encourage them to think not only of things that lie outside their present sphere of influence, responsibility, or possibility (for example, making more use of wind generation) but of things that they can do themselves (for example, walk more, not ask for or buy the latest gadgets, make clothes last longer, take shorter showers).
Note that if, in question 3, the students change more than 1 variable at a time, they will be unable to separate the effect of each. This is why question 3b specifically says to change only 1 variable. For question 3c, too, encourage the students to think about 1 variable at a time and to explore the consequences. Get them to record the changes they make and their impact. One way of doing this could be to print the screen that shows the results at the end of the quiz and annotate it with the changes made; alternatively, the students could capture their eco-footprint “journey” in a table or other data display.
Global hectares also use really big numbers (1 Earth = 13 billion global hectares). Find ways of giving meaning to these numbers. Set the students to fi nd out the area of New Zealand in hectares. Ask: How large is 1 billion hectares compared with all of New Zealand? (New Zealand has about 27 million hectares; 1 billion hectares is about 37 New Zealands or 1.3 Australias.) What other quantities are expressed in terms of billions? (Human population, national budgets, distances in space)
As an extension, discuss how the website calculators illustrate the use of variables, both independent
and dependent. Help them to realise that Earth’s future is the dependent variable: it’s dependent on the independent choices we all make about how we live our lives.
Points of entry: Science
The mathematics of eco-footprints and “Earths” is based on the global hectare (gha) concept. This needs careful discussion and explanation.
A global hectare is not the same as 1 hectare of farmland; rather, the unit is a measure, based on the productive capacity of a standard land hectare, of the productive capacity of the entire Earth, including the resources to be found in the sea, in the sky, and under the ground. Different eco-footprint calculators use different methodologies to convert from gha to Earths. For example, the Earth Day Network website assumes that 1 Earth = 13 billion gha of renewable resources (about 2 gha per person), while the My Footprint website factors in multiple uses of the same area of Earth to get a ratio of about 15 gha per person or about 102 billion gha of renewable resources for 1 Earth.
Some students may be concerned at the lack of exactitude surrounding the gha concept. This variability simply refl ects the uncertainty and complexity of any calculations about Earth’s productive capacity. Every system or formula used involves lots of assumptions.
Have the students compare what we need to sustain life and what we actually use in maintaining our lifestyles. Ask How can we manage resources better to ensure the ongoing survival of the planet? This discussion will inevitably come back to values and, often, to competing values. Link this discussion to the values in The New Zealand Curriculum.
Science is a social activity, done by people. Link your students’ choices to real outputs; encourage them to think of their inputs into the calculator as decisions they make about how to live their lives and to see that these decisions, if carried out, have a real effect on our planet.
Answers
1. Quiz results will vary.
2. a. Answers will vary.
b. Reasons may include: transport used (public transport, car, bike, walking), size of house, whether the family recycles and reuses, the amount of food grown and prepared at home. Resource- consuming activities, such as eating food that has travelled a long way, living in a bigger house than needed to house the occupants, using a fuel-inefficient vehicle, and flying, will increase your eco-footprint. Resource-conserving activities, such as walking instead of driving and recycling
waste, will lower your eco-footprint.
3. a. Compared with Matthew, Adena uses a lot more transport and goods. Because Adena is part of a family, the reasons for this will mostly relate to decisions that have been made by the adults in her family. This means that to reduce her eco-footprint by much, her family may need to do some things differently. Possibilities might include putting the dishwasher on only when full, not upgrading appliances that still work well, getting rid of a second car or replacing a fuel-hungry car with an economical one, consistently recycling and reusing, growing some vegetables, preparing more food at home, making do with 1 computer only, making clothes last longer, fixing items instead of replacing them.
Adena definitely could do some things herself to reduce her eco-footprint, for example, drinking tap water instead of bottled water, taking shorter showers, not leaving the heater
running in her bedroom, not asking for the latest gadgets, wearing clothes longer before replacing them, walking instead of asking for a ride, sharing more things with siblings. She could also take initiatives to reduce the family’s eco-footprint, for example, organising the recycling bin and taking
responsibility for composting organic waste.
b. Results will vary, but changing one variable at one time will help to show the effect of that change on an eco-footprint and help you make decisions about lifestyle choices.
c. Targets and ideas will vary. See answers 2b and 3a for ideas for possible changes.
d. Results will vary. For other ideas, look at less obvious factors that affect the family’s footprint, such as detergent use (some are designed to need only cold water), laundry (do less often and only when there is a full load), or home heating and insulation.