This is a level 3 activity from the Figure It Out series.
A PDF of the student activity is included.
Click on the image to enlarge it. Click again to close. Download PDF (480 KB)
Statistical thinking involves the exploration and use of patterns and relationships in data. There are four key processes:
- describing data – connecting the information in a table or graph with the real-life context
- organising and reducing data – ordering, grouping, and summarising data
- representing data – creating visual representations
- analysing and interpreting data – recognising patterns and trends and using them to make inferences and predictions.
In these activities, the students use data to evaluate different types or models of parachutes.
sticky tape
classmates
string
parachute materials (e.g., plastic bags, foil, paper, cellophane, cloth)
FIO, Creative Technology, Levels 2+-3+, Drop Zone, pages 10 - 11
In these activities, the students analyse the results of experiments. Clarify that a slow descent is a positive attribute of a parachute.
Ensure that the students understand the principle of a “fair test”. Fair testing is where one variable is changed and its effect is measured while other variables are kept constant. For more information and practical examples, see:
- www.sciencebuddies.org/science-fair-projects/project_experiment_fair_test.shtml
- www.ise5-14.org.uk/prim3/new_guidelines/Investigations/Fair_test.htm
Activity One
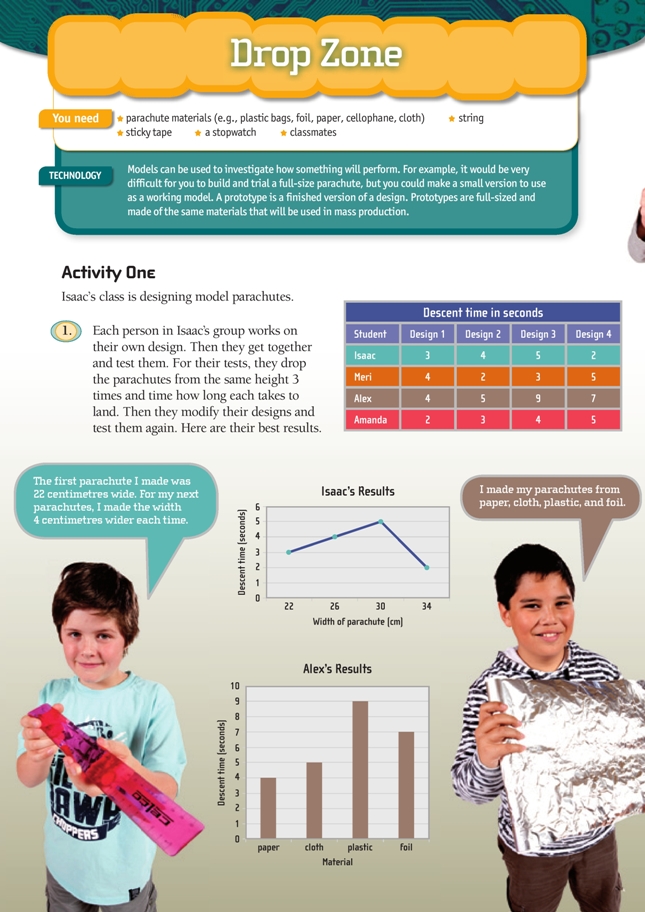
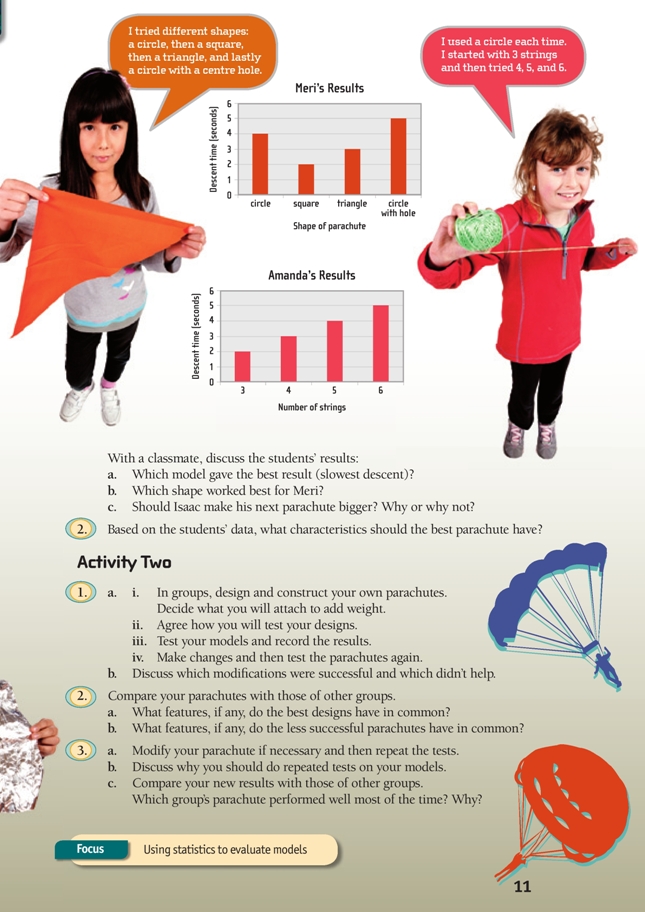
Graphs communicate information by summarising and organising collections of data. Discuss how graphs make it easy to compare results. Ask the students to discuss what the graphs show. Remind them to refer to the numbers as time in seconds.
Discuss the difference between discrete and continuous data. Discrete data is data that can be counted in units, for example, the number of pets that people have. Continuous data is data that is measured, for example, a person’s height. In this activity, the students are working with continuous data in the descent time and discrete data in the variables of shape, material, and number of strings.
Isaac used a line graph to show the results of the changes he made to his parachute. Theoretically, it would be possible to create a parachute with a width corresponding to any value on the horizontal axis, for example, 22.8 cm, or 33.25 cm. Meri, Alex, and Amanda all made category changes. It wouldn’t make sense to have a parachute that has 3.125 strings or that is made from a graduated blend of plastic and foil. For these reasons, a line graph is suitable only for Isaac’s data. Meri, Alex, and Amanda all correctly used bar graphs.
Activity Two
The students could cut out a section of a cardboard egg container and attach the container section to the parachute to hold a weight such as a golf ball. If they find it hard to time the parachute drop, suggest that they try a lighter weight, such as a multilink cube.
When investigating the effect of design changes on descent times, it is important to change only one variable for each trial. If more than one variable is changed, it will be impossible to be sure which variable caused any resulting change in descent time.
Students should perform at least three trials for each model. (They will probably want to do more.) They can decide whether to use the best result, the median, the total for all three, or the worst. The median (the middle value when the values are placed in order of size) won’t be affected by unusual results. In real life, a parachute that sometimes performs badly is a big issue!
Interpreting visual representations of information develops the key competency using language, symbols, and texts. Working as a team to design a parachute provides students with an opportunity to develop the key competency participating and contributing.
Technology-related student activities
Model parachutes and paper planes often feature in “technology challenge” activities. These can be fun and informative, and students can learn about the performance properties of materials and designs for little cost and in a short time period. Such activities can be part of a larger unit but by themselves do not constitute a technology programme.
Sample parachute making instructions are included in the copymaster. A description of Leonardo’s parachute design can be found here: www.raes.org.uk/raes/careers/education/education_makeapara.htm
Exploring the technology-related context
Modification is an important principle in technology. Many solutions to problems don’t suggest themselves immediately, and often people need to change their original ideas, perhaps many times. Edison’s experiments to construct the light bulb are an obvious example. Edison’s trials, and those in this activity, are not strictly controlled scientific experiments or fair tests. They are more trial and error, which has been a factor in many technological developments. Of course, science can assist technologists and technology can assist scientists.
Answers
Activity One
1. a. Alex’s plastic bag parachute had the slowest descent (9 seconds).
b. Circle with a hole
c. No, because the largest parachute he made had the worst result.
2. Based on the best results for each person, the best model might be a plastic, circular parachute, about 30 cm in diameter, with a hole in the centre and 6 strings. (You can’t be totally sure about this because you don’t know the shape and of Alex’s parachute or the size of any but Isaac’s.)
Activity Two
1. a. i.–iv. Practical activity
b. Results and discussion will vary but should include some link between the data gathered and features you kept in later designs. For example, if changing the shape of the parachute improved the performance, you should keep the new shape (as long as the area is approximately the same).
2. Discussion will vary.
3. a. Practical activity
b. A design may work well one time and badly the next. It’s important not to trust just one drop, which may have been a lucky success, but to find a pattern of results.
c. Results and reasons will vary.