This is a level 4 statistics activity from the Figure It Out series.
A PDF of the student activity is included.
Click on the image to enlarge it. Click again to close. Download PDF (616 KB)
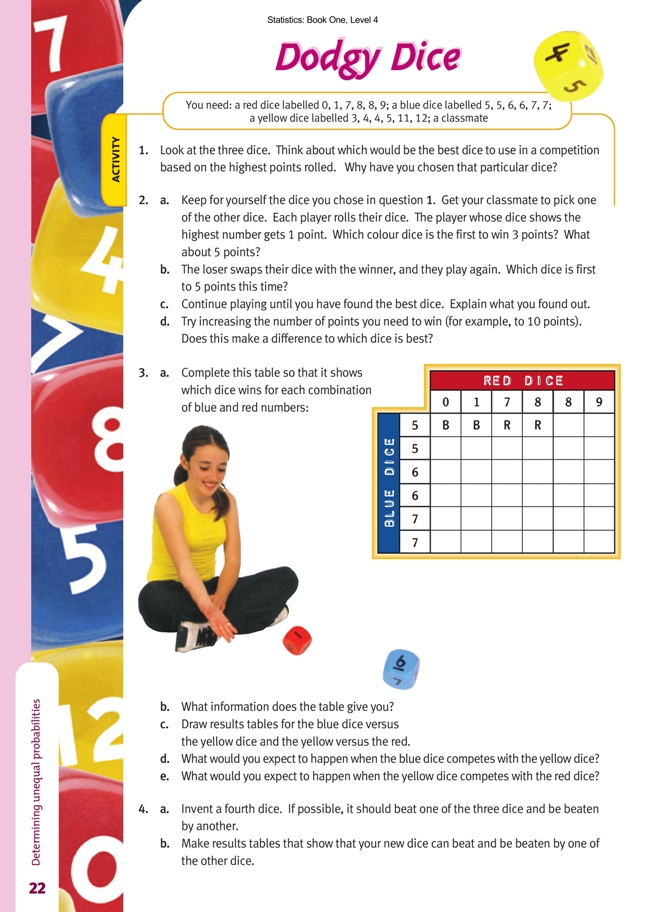
list all possible outcomes using a table
A blue dice labelled 5, 5, 6, 6, 7, 7
A red dice labelled 0, 1, 7, 8, 8, 9
FIO, Level 4, Statistics, Book One, Dodgy Dice, page 22
A classmate
This activity reflects level 4 of the mathematics exemplars rather than the curriculum document. In the exemplars, students not only use fractions to record probabilities but deal with more sophisticated investigations by systematically counting all outcomes or using tree diagrams and then assigning numerical probabilities
on the basis of this count. Entering the results into a table is a simple and logical development of these level 4 skills. See www.tki.org.nz/r/assessment/exemplars/maths/stats_probability/sp_4a_e.php
Unfortunately, many students do not have these skills and are especially weak on fraction concepts. If this is true of your students, you will need to work on these skills before assigning this activity. You should also revise the language of probability.
Dodgy Dice is best used following Wallowing Whales (pages 20–21 of the students’ book), which introduces the idea of long-run relative frequency. This useful concept means that if you do not know the probability of something happening, you can work it out (experimentally) by completing a large number of trials and then
using this formula:![]()
Note that an event is something you want to happen (like getting an odd number when throwing a dice or getting blue to win). A trial is an attempt to get the desired outcome. You will need to explain these words if the formula is to make sense to the students.
At first, when the students play with the dodgy dice, one colour will win, then the other, with no discernible pattern. But as the number of trials increases, a trend will emerge in which one colour is dominant. After 50 trials, the students should have a tentative experimental estimate of the probability, and after 100 trials, they should have a result that is unlikely to change much with further trialling. If a group of students is playing simultaneous games, recording the results on a master table will quickly give enough trials to provide a very accurate result for the experimental estimate of probability.
If the students have already met probabilities as fractions, they can make use of the following formula, which looks very similar to the one above but uses numbers that can be precisely determined (rather than obtained from trials):![]()
The sample space is the complete set of all possible outcomes.
The tables in the Answers are the basis on which the theoretical probability of success for each dice is calculated.
Answers to Activity
1. Explanations will vary. A dice could be picked because it has high numbers or no low numbers.
(You need to be aware that the higher numbers are more likely to score the points in this competition.)
2. a.–b. Practical activity. Results will vary.
c.–d. Practical activity. Results will vary, but in the long run, it should become clear that each dice can beat another one and can be beaten by another one. (See the results for question 3 below.) So no dice is the “best dice” in all circumstances. Increasing the points should make no difference.
3. a.
b. When it is blue versus red, you can expect that in the long run, red will win 22 out of 36 times, the two dice will draw 2 out of 36 times, and blue will win 12 out of 36 times.
c.
d. In the long run, you would expect blue to win 22 out of 36 times, yellow to win 12 out of 36 times, and a draw 2 times out of 36.
e. In the long run, you would expect red to win 16 out of 36 times and yellow to win 20 out of 36 times.
4. a.–b. A dice labelled 1, 2, 3, 9, 10, and 11 nearly works: it will beat red, has a small advantage over yellow, and is the equal of blue. (See the tables below.)