This is a level 5 number activity from the Figure It Out series. It relates to Stage 8 of the Number Framework.
A PDF of the student activity is included.
Click on the image to enlarge it. Click again to close. Download PDF (1026 KB)
convert ratios to decimals to make comparisons
Number Framework Links
Use this activity to:
• develop confidence in students who are beginning to use advanced proportional strategies (stage 8)
• help students consolidate and apply their knowledge of decimals (stage 8).
A measuring tape
A calculator
A computer
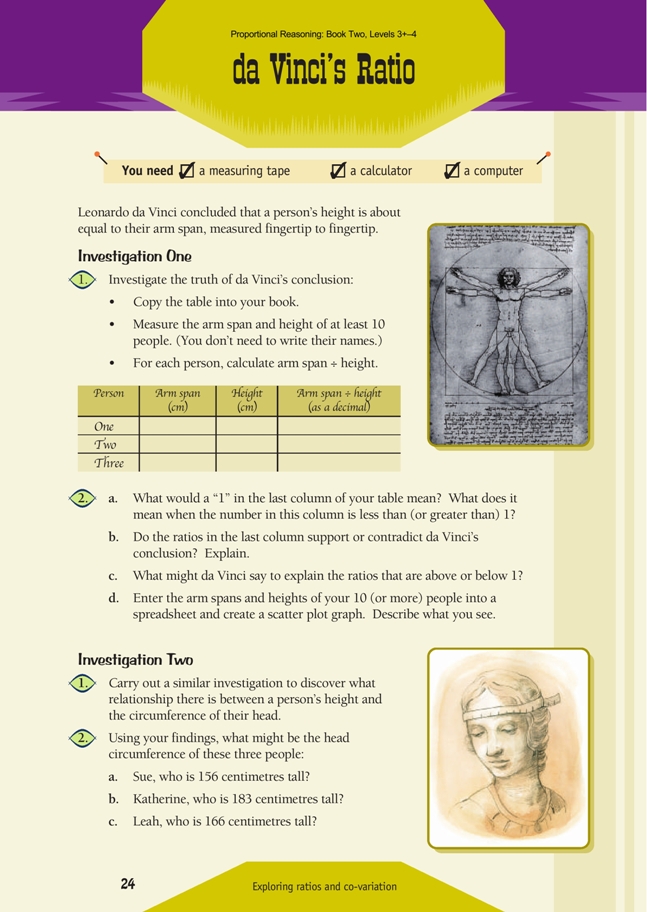
Investigation One
da Vinci’s famous proposition provides an excellent subject for encouraging students to explore how the ratio of two measures might be used to explore a possible relationship between them.
Question 1 is a practical task. Have the students make and record their 10 measurements, rounding them to the nearest centimetre. They should then use a calculator to divide each person’s arm span by their height, entering the result (rounded to two decimal places) in the last column of the table. Before they go on to answer the questions, they should see if they can interpret the numbers they have found.
Question 2a asks students to think about the significance of a ratio of 1. The only way we can divide one number by another and get 1 is if both numbers are the same, so a 1 in the ratio column means identical arm span and height measurements for that person, supporting da Vinci’s hypothesis. A number greater than 1 means that the person’s arm span is greater than their height; a number less than 1 means that the person’s height is greater than their arm span. The closer the ratio is to 1, the better that person’s measurements support da Vinci’s hypothesis.
Some students may not be sure why a decimal number like 1.03 or 0.98 is being called a ratio when there is no colon. Ratios are often expressed as a single number, and like all ratios, these need to be understood in context. If a person’s arm span is 146 cm and their height is 150 cm, this can be expressed as an arm span : height ratio of 146:150 or 146/150 or just 0.97. If it helps, students can think of this as an arm span : height ratio of 0.97 : 1.
When they come to questions 2b–c, your students should find that the ratios they have obtained strongly support da Vinci’s hypothesis. Almost certainly, however, they will have one or two ratios that are a bit further from his ideal of 1. These can be explained as “natural variation”.
There is an excellent activity based on da Vinci’s observation at the New Zealand Census at School
website: www.censusatschool.org.nz/resources/bank/masterpiece/ Students can download data from this site and explore it for themselves. A wealth of further data can be found on the United Kingdom Census at School website. See http://www.censusatschool.org.uk/
Question 2d asks students to enter the measurements they have collected into a spreadsheet and create a scatter plot. Scatter plots are easy to create and are an excellent tool for investigating a possible relationship between two sets of data: if the data points appear to be grouped according to some pattern or principle, there is likely to be a relationship. Here is a scatter plot that uses data from the New Zealand Census at School website: the arm spans and heights of 38 level 3–4 students.
Each point represents a single student:
It should be clear from this graph that (as da Vinci concluded) there is a remarkably close connection (correlation) between the measurements of arm span and height. In fact, the arm span : height ratio varies only between 0.97 and 1.04. If students use the Insert Trendline function to generate the line of best fit (see below), the correlation is even more obvious. Note that the line goes through (140,140), (160,160), and (180,180):
Students may like to investigate da Vinci’s ratio further. If they do so, they will find that it is remarkably constant regardless of country, ethnic group, gender, or historical period. A different and very interesting investigation could focus on da Vinci the man.
Investigation Two
Unlike Investigation One, this investigation starts without an hypothesis, but you could challenge your students to come up with one and then try and show that it is or is not true.
A good starting point would be to get them to discuss in groups whether they think it likely that there is a relationship between a person’s height and the circumference of their head and to explain why they think this.
Investigation should show that the height : head circumference ratio is very close to 3:1.
Answers to Activities
Investigation One
1. Practical activity. Results will vary.
2. a. A “1” in this column would mean that the person’s arm span and height measurements are exactly the same. If the number is less than 1, the person’s arm span is less than their height. If the number is greater than 1, their arm span is greater than their height.
b. The ratios should be similar – all quite close to 1 – showing that da Vinci’s conclusion is close to the truth.
c. da Vinci might explain that, as with any real-life data, there will be variation.
d. Graphs will vary, but the clustering of points about an imaginary straight line should show clearly that a connection does exist between arm span and height.
Investigation Two
1. Practical activity. Results will vary. There is a relationship between head size and height. (We would certainly notice if someone’s head seemed too big or too small for their body.) But the relationship is not exact, and it changes from birth through to when growth stops in the late teens. For a mature adult, their height is typically
about 3 times the circumference of their head. For a child of early school age, their height is typically about 2.2 times the circumference of their head.
2. Answers will vary. Using an adult height:circumference ratio of 3:1, the head
circumferences should be approximately:
a. 52 cm
b. 61 cm
c. 55 cm.