This is a level (3+ to 4+) mathematics in science contexts activity from the Figure It Out series.
A PDF of the student activity is included.

Click on the image to enlarge it. Click again to close. Download PDF (1056 KB)
Students will:
- decide on appropriate ways to measure the amount of water lost in Activity Two
- calculate percentages of large numbers and percentages of percentages.
Students should discover that:
- a small percentage of a large number can itself be a large number
- a familiar context can help give meaning to a large number.
a scientific calculator or one on a computer
5 litre bucket(s)
access to the Internet
plastic cups
FIO, Using Resources, Levels 3+-4+, Clean Enough To Drink?, pages 18 - 19
Preparation and points to note
Before starting this activity, consider collecting samples of water from different sources and using these as a basis for initial group and/or class discussion: What makes water drinkable? Why can’t we drink sea water? Students will have relevant experiences to share and build on. Some may come from countries or areas where drinking water is scarce.
To get the most out of this activity, students will need to work co-operatively. This gives them an opportunity to develop the key competency participating and contributing.
The activity involves percentages and large numbers. Students need to bring to it some experience and confidence with percentages. They need to know, for example, that if 90% of fresh water is in Antarctica, only 10% is to be found elsewhere; that 0.25% is one-quarter of 1%, not 25%; that 15% is entered into a calculator as 0.15; that “80% of …” involves multiplication; and that it is possible to calculate a percentage of a percentage. Calculators are appropriate and necessary.
Students could work collaboratively to identify and extract the information that is relevant for each question.
Points of entry: Mathematics
There are several different usages of percentage in this activity; for example, percentage of a whole, percentage lost, and percentage of a percentage. This highlights the importance of students learning that, when working with percentages, they must pay careful attention to the context. Avoid teaching “rules” about percentage because they encourage students to ignore the context and go straight to the numbers. Discourage use of the percentage key found on some calculators – it is unnecessary and obscures the process you want the students to understand.
Because of the very large numbers involved, many students will find question 2c in Activity One difficult, even if they understand what needs to be done. Most calculators express large numbers using scientific notation (the estimated volume of water on Earth will appear as 1.43385454915 km3), which will create an unnecessary distraction. Using “millions” as the unit avoids this. See the answers for a straightforward calculation and explanation.
Note, however, that saying Earth’s population in 2009 was 6 778 millions is not quite the same as saying that it was 6 778 070 000. It would be worth discussing this with your students. Ask Is such rounding justified? (Yes. These figures are all very approximate and, anyhow, world population changes by the minute.) Students usually find it difficult to understand that, in some circumstances, a rounded figure (for example, 458 000) might more accurately represent a situation than one with more significant digits (such as 458 437).
A single cubic kilometre of water is a huge amount, so the students will probably conclude that there is plenty of fresh water for everyone. This is mathematically true, but it does not take account of distribution: water is often not where it is needed. Even within New Zealand, the West Coast may be experiencing constant rain while the Canterbury Plains, the Wairarapa, or Gisborne is suffering severe water shortages.
Points of entry: Science
Review the water cycle. Your students may not realise that water can exist in different forms or be purified by relatively simple means.
While fresh water is a renewable resource, access to clean fresh water is steadily decreasing. Have your students brainstorm the reasons an area might run out of drinkable water. These should include changes in weather patterns, over-irrigation, lack of suitable storage, diversion by a neighbouring country, alternating wet and dry seasons (monsoon), deforestation, pollution, urban development that increases run-off, lack of effective distribution network, poverty, corruption, or political turmoil. They should note that most of these reasons stem one way or another from human decision making and activity.
In Activity One, the students will work out that, in theory, there is plenty of fresh water for everyone. There are enormous amounts of fresh water in the North American Great Lakes, in the world’s great rivers, in huge groundwater aquifers, and in countless smaller rivers and lakes, including those in New Zealand. The problem is that many people live in places where water is not plentiful and/or where there is no effective distribution network to get it to the people who need it.
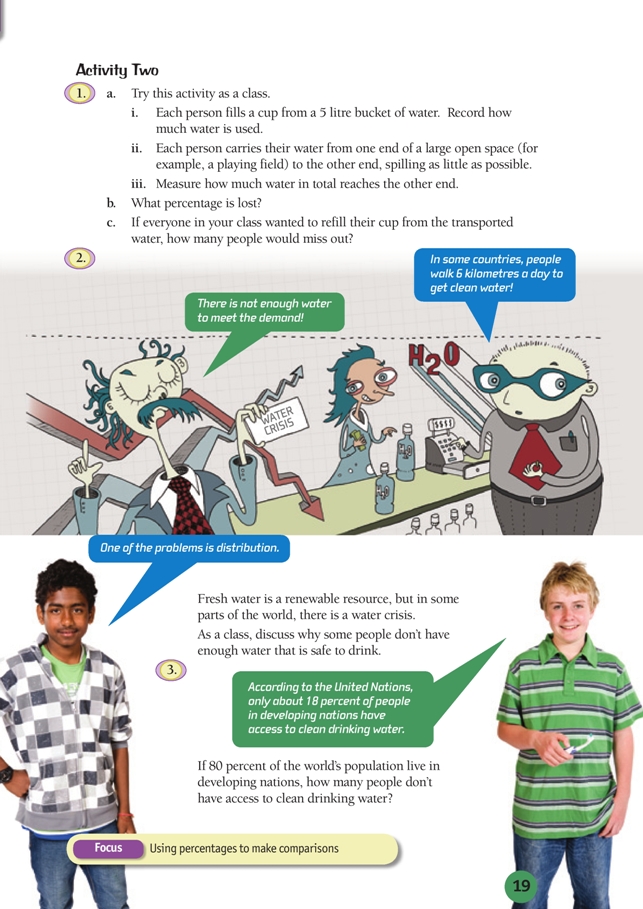
In Activity Two, the students carry out a simple simulation that is designed to demonstrate how easily water is lost in distribution. Relate the findings of this simulation to the earlier discussion on why so many people don’t have the water they need.
Answers
Activity One
1. Lists will vary. Possible sources include: tap water, stream, river, pond, sea, wetland, rainwater tank, and well. Which of these are safe to drink will also vary (for example, only some streams and rivers are safe to drink from).
2. a. Discussion will vary. In general, the water in Antarctica is locked up in ice, snow, and glaciers, and it would be very difficult getting it to where it is needed.
b. 0.25%. (97.5% of water is salty, leaving 2.5% fresh; 90% of this fresh water is locked up in Antarctica, leaving 10% available; 10% of 2.5% is 0.25% [one quarter of a percent].)
c. Approximately 529 cubic kilometres (km3) per person. (For ease of calculation, work in millions: 0.25 % x 1 433 854 549 millions = 3 584 636 million km3 of potential drinking water; divide this by the world’s 2009 population in millions to get 3 584 636 ÷ 6 778 = 529 million km3 per person.)
Activity Two
1. a. Practical activity
b. Answers will vary. One way to work out (in litres [L]) how much water is lost is: subtract the amount that reached the end from the amount you started with; divide the total amount by the total starting amount and then multiply the result by 100 (to give a percentage). For example, if the class started with 7.5 L and transported just 4 L to the other end, that means 3.5 L was lost. 3.5 ÷ 7.5 x 100 = 46.7% of the water was lost.
2. Discussion should cover reasons relating to distribution, pollution, and wastage. Water may
not be available where people live (a distribution issue), filtering and pumping stations may have
limited capacity (a wastage issue), holding tanks or dams may not be efficient for conserving
water (a wastage issue), water sources may be contaminated (a pollution issue), or water might
be used to grow thirsty crops that are not suited to dry areas (a wastage issue). The issue of
deforestation might also come up: deforestation can change rainfall distribution patterns.
3. About 976 042 080 people. (18% of 80% [0.18 x 0.8 = 14.4%] of the world’s population doesn’t have access to clean drinking water. Using the information provided on page 18, 14.4% of the world’s population is 0.144 x 6 778 070 000 = 976 042 080.)