This is a level 4 statistics activity from the Figure It Out series.
A PDF of the student activity is included.

Click on the image to enlarge it. Click again to close. Download PDF (1169 KB)
interpret information from tables
evaluate sample
make a conclusion
This diagram shows the areas of Statistics involved in this activity.
![]()
The bottom half of the diagram represents the 5 stages of the PPDAC (Problem, Plan, Data, Analysis, Conclusion) statistics investigation cycle.
Statistical Ideas
Cheap Reads involves the following statistical ideas: using the PPDAC cycle, evaluating statements madeby others, posing investigative questions, using multivariate data sets, and investigating samples andpopulation.
A computer spreadsheet/graphing program (optional)
Activity One
Before the students answer question 1, discuss with them why and how magazines might want to use the data about readership numbers. You may need to point out to them that the largest part of a magazine’s revenue is from advertising rather than from the cover price. Encourage them to work out for themselves that larger readership numbers means a magazine can attract more advertisers or charge them more. Magazines would therefore want to paint a favourable picture of their readership numbers and can sometimes use readership data to help them do this.
Have the students go on to look at the readership table in question 1 in the light of this discussion. For example, Woman’s Time would want to focus on the primary readership fi gure (which represents actual sales), whereas Starry-eyed would want to focus on overall readership, including casual readers who don’t buy the magazine (advertisers are still interested in this figure). In each case, one of the magazines has the largest figure and thus would want to emphasise the point with potential advertisers.
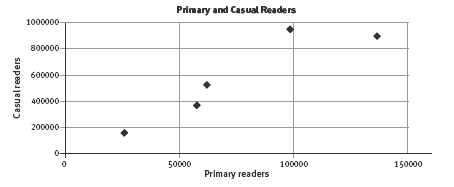
For question 2, the students can make comparisons simply by looking at the numbers, but they could also make a scatter plot to see how closely related primary and casual readership are.
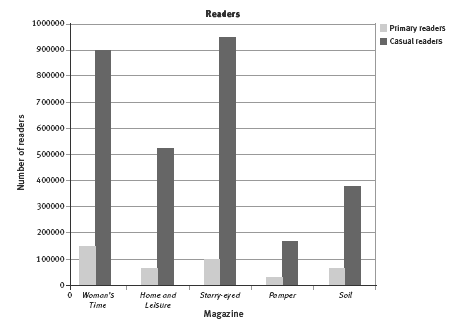
A bar graph is an alternative way of highlighting the variation in casual readership.
If the students have access to the Internet, a search on “magazine readership New Zealand” gives information that may help them answer the various parts of question 3.
Activity Two
This activity can be done as a precursor to the Investigation or you may decide to combine the two. Your students may prefer to go straight to collecting new data using real magazines that they are familiar with. You could conduct a focus-group survey of a number of familiar magazines and record the data in a similar manner to that in the activity. 20 students were involved in the focus-group survey in this activity, so it may be useful to use the same number of students for comparison purposes.
Questions 1 a–c can also be asked of your class’s own data.
For question 2, a discussion about how samples can be used to make predictions about the wider population would be useful. It is important to discuss with the students what a representative sample is; the samples from your own class (or the one used in the student text) are not representative of all students because the
students in the sample form a very particular demographic.
For question 3, note that Sarah or your own students can only make conclusions based on their sample groups. If Sarah follows the PPDAC cycle, she may now have new questions to investigate, based on the data she has already collected and analysed. For example: “Is there a difference between what magazines girls
and boys read at this age?” Brainstorm with your students possible follow-on investigative questions.
Extension
Here are the 2008 advertising prices for spreads in a popular New Zealand magazine:
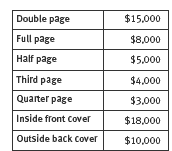
Using these prices as a benchmark, your students may like to examine the total advertising revenue for magazines that they are familiar with. They could compare how much advertising revenue is contained in the first 10 pages and how much in the last 10 pages and discuss any differences.
Students could also get two copies of the same magazine and cut out all the advertising, taking note of the page number. They could make a big display of this, calculate the area and percentage of the page taken up in ads, and then make a line graph (using the page numbers on the horizontal axis).
Information on readership may be found on media research websites, which often provide current figures on categories such as magazine and newspaper readership.
Investigation
See the comments for Activity Two.
Answers to Activities
Activity One
1. a. Starry-eyed
b. Woman’s Time
2. There are significantly more casual readers than primary readers. The magazines with more primary readers tend to have more casual readers as well.
3. a. Comments will vary. Primary readership is based on sales and can therefore be quite accurate. Casual readership is more likely to be based on data from
media research companies, who do surveys to make estimates. (An Internet search on magazine readership will give more information on this.)
b. Magazine publishers and advertising agencies would be interested in this information. They would obtain information from media research companies (who
would get some of their information from distributors of the magazines).
c. Many people hand their magazines on to places such as hospitals, hair salons, dentists, or doctors for people to read while they are filling in time.
Activity Two
1. a. C-Zone and Cartooner
b. 2 Much and Cartooner
c. Answers will vary, depending on the type of ad, but probably C-Zone or Cartooner because the greatest number of people (from this survey) purchased and/or read them.
2. a. The data is not very reliable for the wider population of that age group but is probably quite representative of students of that age in that school (depending on how the 20 students were selected).
b. It depends on whether the focus group is restricted in terms of age, gender, location, income, and so on.
3. Sarah might conclude that a wide range of magazines are typically read by young people of her age. Some of the more popular reads are Cartooner and C-Zone, with
90–95% of those surveyed reading them. Frenz and 2 Much are also popular, with 75% of those surveyed reading them. The least popular were Polly and Wrestle,
with only 45% readership.
Investigation
Investigations and conclusions will vary.
Key Competencies
Cheap Reads can be used to develop these key competencies:
• thinking: designing investigations and thinking fl exibly
• using language, symbols, and texts: interpreting statistical information and communicating fi ndings
• relating to others: listening actively
• managing self: working independently, planning, and persevering.