This is a level 4 statistics activity from the Figure It Out series.
A PDF of the student activity is included.
Click on the image to enlarge it. Click again to close. Download PDF (672 KB)
plan a survey
collect data
display data on a graph
interpret data
A computer
This activity can be used to build on the work done in What’s the Question? and Discipline Dilemmas (pages 4–5 and 10–11 of the students’ book). If you have not already attempted these activities, review the discussion on them in these notes.
This activity introduces the students to the concepts of a population (an entire group) and a sample (part of the population). Both are very important statistical concepts.
If a population is small, it may be realistic to survey everyone. Occasionally, everyone in a large population is surveyed (as in a census, general election, or a referendum), but the costs of doing this are so great that such occasions are rare. Generally, statisticians use the less complex and less costly alternative of surveying a sample.
As long as the sample is selected so that it is genuinely representative of the population, surveying those in the sample should give a result that is very close to the result that would be obtained by surveying everyone.
The challenge is to ensure that those in the sample have the same characteristics, in the same proportion, as those in the population. This will normally mean that characteristics such as the gender mix and age mix of the sample closely match those of the population.
In theory, when a sample is being selected, the method used should give every member of the chosen population an equal chance of being chosen. This ensures that the views of the sample accurately reflect those of the population. If surveying a local town or suburb, one strategy would be to survey every house with a street number that is a multiple of 10. This is called a systematic sample. By contrast, a survey in
which people are stopped on the street uses an informal sample; the only people surveyed are those who are easy to locate. Statistically, this is a haphazard way of finding out the views of the population because people who are in the same place at the same time often have a common characteristic that causes them to be there or means that they are able to be there.
A further consideration is the “method of contact”, that is, the way those selected for the sample will be contacted. Face-to-face surveys are more likely to get a response than faxes or emails. Response rates are very important for the validity of the statistics collected. Those who do not answer a survey are known as non-respondents. If a lot of people in the sample do not respond to the survey, any conclusions reached are likely to be invalid because they will not genuinely reflect the views of the population as a whole. People who do not respond tend to fall into categories (for example, busy businesspeople). As a result, the survey fails to uncover the views of a whole segment of the sample, and therefore of the population. In practice, it is very hard to get a high level of response to a survey, and this is one reason why the results of any survey have a “margin of error”.
These important ideas can be introduced to students studying at this level, but their treatment should be kept simple. The goals at this stage are to get the students to recognise the difficulties involved in conducting surveys and to develop in them a healthy scepticism for the results of any survey. They will revisit these concepts if they continue to study statistics in senior high school.
When developing their surveys, your students need to note that the more questions they ask, the more work there will be in collating, sorting, displaying, and interpreting their data. A group of able students may take 2 weeks to complete question 3. Students working alone will take longer because the data-collection phase is time consuming. Students working in groups are likely to get much more out of the task because they will debate the issues while sharing the workload.
Answers to Activity
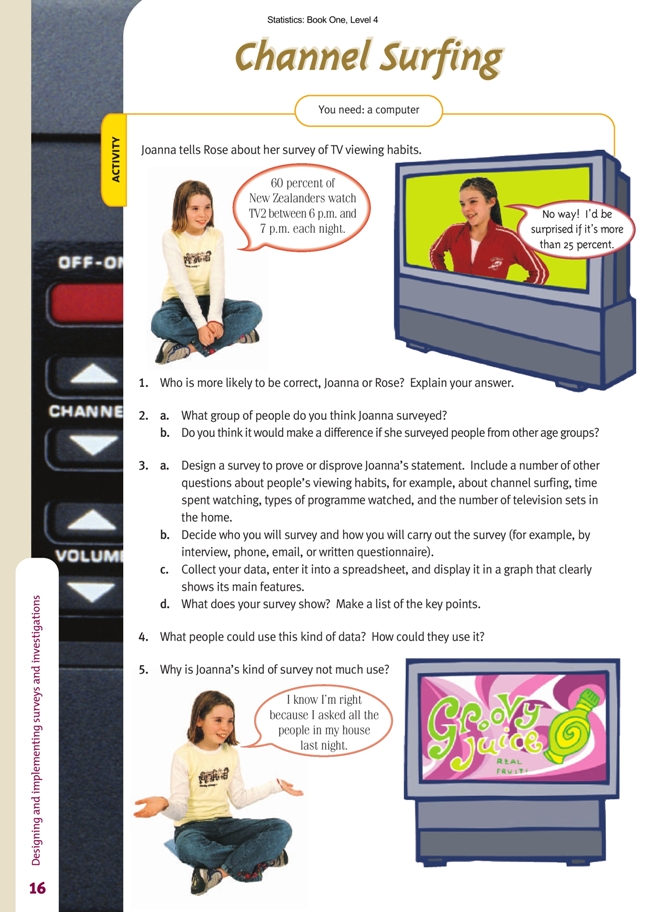
1. Rose, but even her figure is probably too high. A large number of people are returning from work or eating dinner at this time. There are plenty of others who don’t watch TV because they prefer doing other things. In spite of what Joanna says,
it is not clear if she means all New Zealanders or all people watching TV at that time.
2. a. She may have interviewed mainly young people or just her household (as suggested in the bottom picture).
b. Yes. Viewing habits vary greatly between age groups. If she surveyed people in a
retirement village, she would find that a high proportion watches the news in the evening, but if she surveyed teenagers, she would be likely to find that the opposite is true.
3. a.–d. Practical activity. Results will vary.
4. TV networks. Advertisers could use the data to decide when and where to place advertisements so they will reach certain audiences.
5. The sample group is too small. Generally, the larger the sample size, the more accurate the results. Also, data must be collected using systematic methods if the results are to be valid.