This is a level 2 activity from the Figure It Out series.
A PDF of the student activity is included.
Click on the image to enlarge it. Click again to close. Download PDF (665 KB)
Making comparisons is an important part of most statistical investigations. In these activities, students use data to compare people’s perceptions about the relative impact of technological discoveries. They are asked to interpret tables showing rankings and ratings.
FIO, Technology Rules!, Levels 2+-3+, A Changing World, pages 4 - 5
In this activity, students evaluate technological items according to their impact on people’s lives.
Activities One and Two
In Activity One, students are asked to interpret rankings. In Activity Two, they interpret ratings. You can use these activities to explore the difference between rankings and ratings with your students.
Rankings
When items are ranked, each item is given a unique value. A problem arises when a person believes that two items are equivalent. Rankings may force them to differentiate between the two items unless they are given the option of equal rankings.
Rankings sometimes cause confusion because the first ranked item has a lower “score” than a lower ranked item.
Statistically, rankings should not be averaged because the distance between rankings is not uniform. For example, there may be a large difference between the items ranked first and second but only a small difference between the items ranked third and fourth.
Ratings
Ratings allow items to be given equal “scores”. For example, a group member could give every item the same rating. This can make it harder to differentiate between items in a list and is particularly true when the range of ratings is small. For example, in Activity Two, there are only 3 rating options. However, it may be fairer than forcing survey participants to impose a hierarchy on items when perhaps none exists.
Ratings sometimes reflect people’s individual tendencies. For example, some people may seldom give high ratings, others may give all high ratings. The more people who are surveyed, the more valid the end results will be.
Studies have shown that survey questions that involve ranking take around three times longer to complete than rating questions (Munson and McIntyre, 1979). Discuss possible reasons for this with the students.
Students could design two surveys to determine people’s preferences, one that uses rankings and one that uses ratings. Discuss: Do the items end up in the same order? Why or why not?
Activity Two
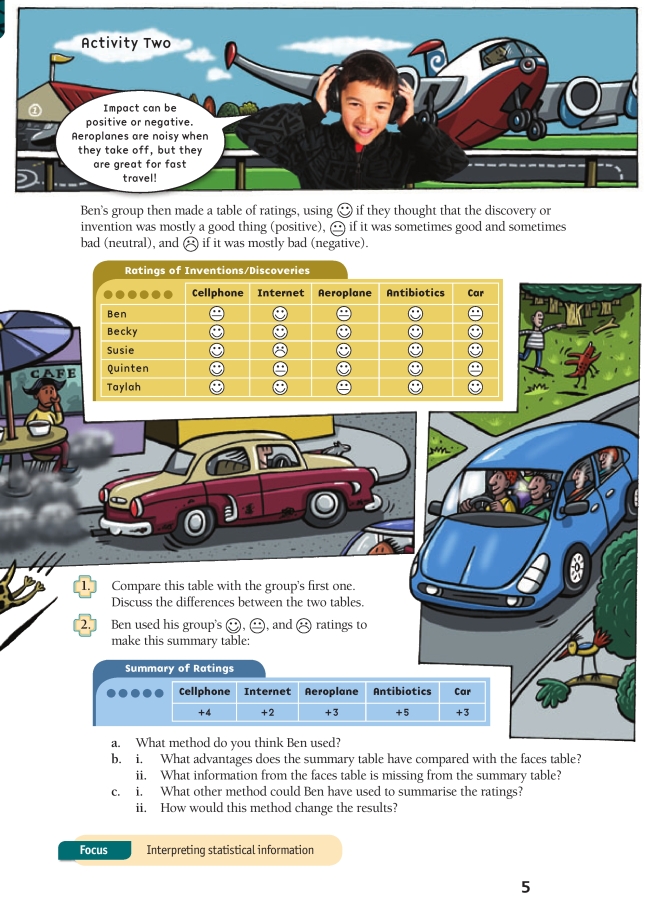
Ben’s group has used qualitative (non-numerical) data to rate the benefits of the inventions. This is useful visually because the faces have a natural association with positive and negative feelings. However, to analyse the information further, the information needs to be converted into quantitative data (numerical data).
Ben subtracted a point for each ![]() face. Integers are not introduced until level 4 of the curriculum, but students should be able to identify that a
face. Integers are not introduced until level 4 of the curriculum, but students should be able to identify that a ![]() adds 1 point and a
adds 1 point and a ![]() takes one away.
takes one away.
These activities provide an opportunity for students to develop the key competency using language, symbols, and texts through interpreting information and results in context.
Technology-related student activities
- Construct a table of inventions, listing positive and negative consequences.
- Follow the evolution of a technology and how it affected people. For example, show the development of writing implements from quills to pencils to pens.
- Debate “the most important invention or technology” (see http://science.howstuffworks.com/innovation/inventions/10-inventions-that-changed-the-world.htm).
- Investigate how some people receive a new technology, for example, the Luddites, Cargo Cults, use of goal-line technology and video replays in football (see http://news.bbc.co.uk/sport2/hi/football/8553463.stm).
Exploring the technology-related context
Technology can affect people in different ways. Sometimes it can be beneficial, and at other times its impact is extremely negative. What may assist one culture may not necessarily be welcomed by another.
Answers
Activity One
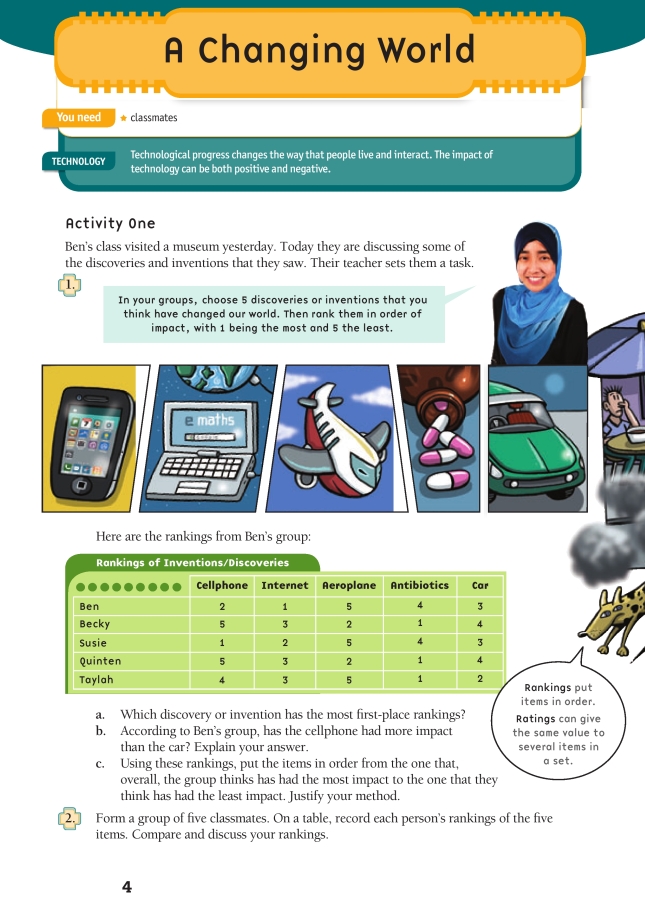
1. a. Antibiotics
b. Answers will vary. The cellphone had 1 first-place ranking but 2 fifth-place rankings, whereas the car’s rankings ranged from 2 to 4. Overall, the cellphone’s “score” was 17 and the car’s was 16, so there was very little difference.
c. Answers will vary, depending on the method used. If totals are found for each column, the order (based on the lowest total being the highest ranked) would be: antibiotics, Internet, car, cellphone, aeroplane. Antibiotics had 3 first-place rankings and the aeroplane had 3 fifth-place rankings, which supports this conclusion.
2. Rankings and discussion will vary.
Activity Two
1. Comments will vary. For example, in the first table, where each item is ranked differently, antibiotics was voted as having the most impact. In the second table, everyone voted the impact of antibiotics as positive, but someone who had reacted badly to an antibiotic may well have given that item a neutral face. The ratings table has less variation because there are only three options (![]() ,
, ![]() , and
, and ![]() ), and each person can use each face more than once.
), and each person can use each face more than once.
2. a. Ben gave 1 point for each happy face, 0 for a neutral face, and subtracted 1 for each sad face, then added up the totals.
b. i. Answers will vary. The summary table is faster to read because it contains less detailed information. This helps you to quickly compare different inventions or discoveries.
ii. The faces table shows all the ratings from each student, while the numerical table is just a summary. If you only use the summary table, you don’t know how any one student ranked the various items – a summary of +3 could be 3![]() s and 2
s and 2![]() faces or 4
faces or 4![]() s and 1
s and 1![]() face.
face.
c. i. Answers will vary. Ben could have given a score of 0 for an invention with a negative impact, 1 for an invention with a neutral impact, and 2 for an invention with a positive impact.
ii. In the example in i, the rankings would be the same.