This is a level 4 activity from the Figure It Out series.
A PDF of the student activity is included.
Click on the image to enlarge it. Click again to close. Download PDF (257 KB)
graph paper
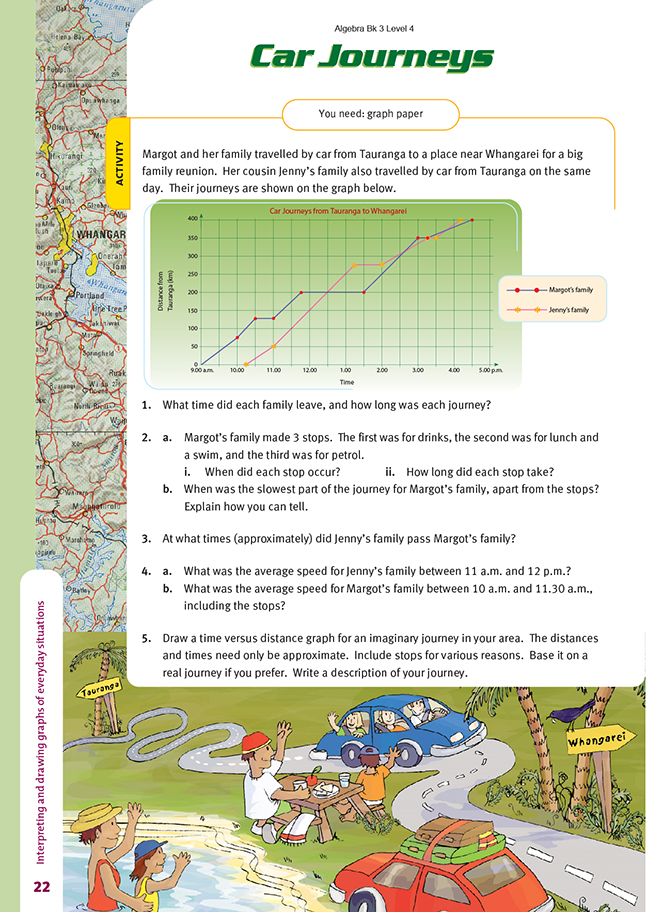
In this activity, students first interpret distance–time graphs that illustrate two car journeys from Tauranga to Whangarei on the same day. While distance–time graphs may seem clear and simple to interpret, many students see quite different messages depicted in the graphs. For example, it is quite common for students to interpret these graphs as “going up a hill” rather than the way the distance travelled changes with time. Students may therefore benefit from working through tasks such as the one below.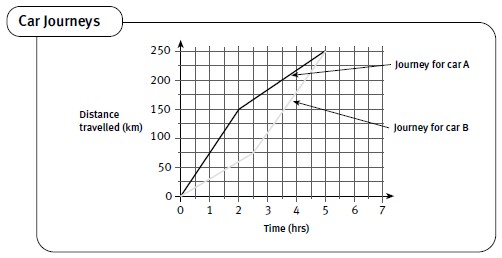
Each car represented in this graph takes 5 hours to complete 250 kilometres. So the average speed, that is, the total distance travelled divided by the time taken, for each car is 250 km ÷ 5 hrs = 50 km/h. Note, however, that car A completes the first 150 kilometres in 2 hours. The average speed for this part of the journey is 75 kilometres per hour. The next 100 kilometres take 3 hours for car A. So the average speed for the second part of the journey for car A is 33.3 kilometres per hour. Car B travels the first 75 kilometres in 2.5 hours at an average speed of 75 km ÷ 2.5 hrs = 30 km/h and the remaining 175 kilometres also in 2.5 hours. The average speed for the second part of the journey for car B is therefore 175 km ÷ 2.5 hrs = 70 km/h. Students might see if they can use the information above to tell, from the graph, which part of each journey is the fastest and which is the slowest. The rule that should emerge is the steeper the line, the greater the speed. This makes sense, as it means that more distance is being covered for a given amount of time. A line close to vertical represents very high speed (a great distance in very little time), and a horizontal line
represents zero speed (time passes, but no distance is travelled).
In question 1, the students must see that the starting time for Margot’s family was 9.00 a.m. and the starting time for Jenny’s family was 10.15 a.m. Margot’s family completed the 400 kilometre journey at 4.30 p.m., that is, after 7 hours, 30 minutes (including stops), while Jenny’s family completed the journey at about 4.10 p.m, that is, after about 6 hours (including stops).
In question 2, the horizontal parts of the graphs represent stops because no distance is covered for the particular time interval. In question 3, the students locate the points where the graphs intersect. The times and distances for these points indicate when and where the passing occurred.
In question 4, the students must calculate the speed travelled over a particular section of the journey. They do this by dividing the distance travelled in that section by the time it took. So, for example, in question 4b, Margot’s family travelled 100 kilometres (175 km – 75 km) between 10 a.m. and 11.30 a.m., which gives a speed of 100 kilometres per 1.5 hours, or approximately 67 kilometres per hour.
In question 5, the students use what they have learned from the earlier questions to draw graphs related to their own experiences, either real or imaginary. Students completing this question successfully will have demonstrated a clear understanding of how, for example, distance can change with time for particular everyday situations.
Answers to Activity
1. Margot’s family left Tauranga at 9.00 a.m. Their journey took 7 hrs, 30 min. Jenny’s family left Tauranga at 10.15 a.m. Their journey took approximately 6 hrs.
2. a. i. The drink stop was at 10.30 a.m. Lunch and a swim was from 11.45 to 1.30 p.m. The petrol stop was at 3.00 p.m.
ii. The drink stop took 30 min. Lunch and a swim took 1 hr 45 min. The petrol stop took 15 min.
b. The slowest part of the journey for Margot’s family occurred between 3.15 and 4.30 p.m. The graph between these times is less steep than for any other part of the graph except for during stops. The less steep the graph, the lower the speed. (They covered 50 km in 1 hr and 15 min, and their speed during this period was 40 km/h.)
3. Jenny’s car passed Margot’s car at approximately 12.30 p.m. and 3.45 p.m. (Margot’s car passed Jenny’s car at approximately 2.40 p.m.)
4. a. 100 km/h. (They travelled 100 km in 1 hr.)
b. Approximately 67 km/h. (They travelled 100 km in 1 1/2 hrs.)
5. Answers will vary.