This is a level (2+ to 3+) mathematics in science contexts activity from the Figure It Out series.
A PDF of the student activity is included.
Click on the image to enlarge it. Click again to close. Download PDF (1235 KB)
Students will:
- gather data on how long it takes for various items to decompose
- represent data on a timeline
- draw conclusions from data.
Students should discover that:
- patterns can be found in data
- these patterns have meaning.
a classmate
access to relevant books and/or the Internet
Preparation and points to note
Although the issues explored by this activity are important and urgent, there is little readily available,
authoritative information on how long it takes for different types of waste to decompose. If students input “waste breakdown times” into a browser and look at the few references that are clearly on the topic, they are likely to fi nd the same or similar unsourced data popping up. According to one analysis (see www.thatdanny.com/2008/06/06/how-long-does-it-take-a-plastic-bag-or-a-glass-bottle-to-decompose/?), there are three similar lists of items and times circulating, and these came originally from The New York Times (2001), Penn State University, and Pocket Guide to Marine Debris (The Ocean Conservancy, 2004). The data in the table in the answers (above) comes from these lists.
An Internet search under “compostable school” will bring up some useful websites on compostables, including the introduction of compostable lunch trays, plates, and plastic bags.
As for many other environmental questions, there are no simple answers to questions about waste breakdown times. Different materials decompose at different rates depending on a host of environmental factors that include temperature, presence of moisture, exposure to sunlight, whether or not they are buried, and if buried, how deep and in what kind of substrate. Also, plastic products have only been around for a few decades (fewer than 50 years, in most cases), so scientists have little historical data to go on. Students need to be able to come to terms with such uncertainty, recognising the reasons for it.
If computers are not available, you could simply give your students the data in the table and ask them to estimate for other items they may have listed. This would, however, remove the value of the activity in terms of teaching research skills.
This activity challenges students to make sense of patterns within sometimes disparate information. It is therefore well suited to a focus on the key competency thinking.
Points of entry: Mathematics
How long is forever? In this case, the term means simply “so long that we can’t measure”. All things will eventually wear away from the action of wind, water, or geothermal activity, but many of the products we use every day will outlast us – some may outlast humankind.
Timelines are well-suited to portraying information like this. They organise time-related data so that
relationships can be easily observed and interpreted. They are also easy to create. The students could create small-scale timelines in their books or on A3 paper. If there is space along a classroom wall, a group of students could create a larger-scale timeline by fi rst joining sheets of paper together.
Students need to find a way of coping with data that is provided as a range (for example, 30–40 years). The suggestion in the students’ book is to use the point that is midway between the two given numbers (that is, the median). Alternatively, a case could be made for using the larger of the two numbers, given the uncertainty around the times. Encourage your students to think about the meaning of the numbers and the issues around them. They should not get too worked up about the “exact” place to put a number that may be little more than an educated guess!
Points of entry: Science
Encourage the students to investigate why some items take longer to break down than others. Link the question to their own knowledge of the environment: If wood took forever to break down, what would forests look like? Why do we see plastic rubbish washed up on the shore but little paper rubbish?
Things break down for a reason. Encourage the students to realise that some waste items are sources of food for animals or micro-organisms, and some are not. Those that are will completely decompose over time unless they are placed where animals or micro-organisms can’t access them or can’t survive. Items made of plastic or metal are not sources of food so they take much longer to break down and, even when they do, they may leave a residue. Specific everyday items can be the focus for investigation or discussion. For example, an apple (the activity of micro-organisms, animals), an animal (the activity of other animals, maggots, micro-organisms), newspaper (the activity of micro-organisms, fire), a tree (the activity of animals, fungi, micro-organisms, fire), a tin can (chemical action [rusting]), an aluminium can (chemical action [corrosion]), rock (water, temperature
change, chemical action, plant action, abrasion [slow mechanical demolition]).
Have the students think critically about how they categorised their data. Ask: Which data did you find the most surprising? Which data was easiest to explain or understand?
Some students may note that glass and polystyrene both take an extremely long time to break down. Ask Does this mean that the two materials pose similar environmental issues? You could challenge interested students to research and compare these materials: how they are made and used, how they are disposed of, under what circumstances they break down, and what the implications are of continuing to use large volumes of these materials.
Simple experiments can demonstrate how conditions affect the breakdown of materials. For example, test manufacturers’ claims that a plastic bag is biodegradable: put one bag in a jar on a sunny window ledge, put one in a jar in a dark cupboard, bury one 50 centimetres down in a place where it can be found again. Or take several apples and leave/bury them in different environments. Plan such experiments so that they follow the scientific inquiry process (see the chart on page 5).
Students could also investigate how the presence or absence of moisture/water affects the breakdown of organic materials.
A final discussion could include questions such as: If you were to bury the contents of a school rubbish bin and leave it for 100 years (like a time capsule), what would the people who dig it up fi nd? How would the answer to this question be affected by the place (particularly soil and climate) and conditions (type of container)? Would people in 100 years’ time be interested in our rubbish? What might they think about us, judging from what we threw out?
Answers
1. a. Under normal conditions (that is, when not buried in a landfi ll), the time an item takes to break
down depends on a variety of factors, including temperature, moisture, chemicals in the soil, work of
bacteria, and exposure to air and sunlight. The table gives suggested times for some everyday items.
(Different sources suggest different times; even so, they show clearly that some items break down
quickly and others may never.)
| Item | Time to break down | Item | Time to break down |
| Apple core | 2 months | Orange peel | 1–6 months |
| Aluminium can | 80–500 years | Newspaper | 6 weeks |
| Cigarette butt | 10–12 years | Plastic bag* | 10–20 years |
| Disposable nappy | 75 years | Plastic bottle* | 450 years |
| Glass bottle | Forever | Polystyrene* | Forever |
| Nylon fabric* | 30–40 years | Tin can | 100 years |
| Leather | Up to 50 years | Wool socks | 1–5 years |
| Milk carton | 5 years | Bread | 3–4 weeks |
* Even when these petrochemical products break down, they leave traces in the environment.
When buried in a landfill, most waste (even food scraps) does not break down because the mass that covers it tends to “mummify” it.
b. Timelines will vary. Here is an example, using data from the above table:
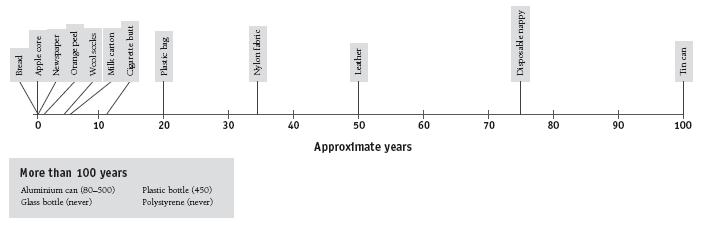
c. Discussion will vary. Points might include:
- There is very big difference in the time it takes for different items to break down.
- Fruits break down quite quickly.
- Some very common items will not decompose in a human lifetime.
- Items that don’t break down in 100 years or less can take hundreds of years to break down.
2. Recommendations will vary. For example:
- items that decompose within a matter of months should go into a compost bin
- items that decompose within 5 years could go into a landfi ll with a 40 year lifespan
- items that won’t decompose in a lifetime should go into a permanent landfill.
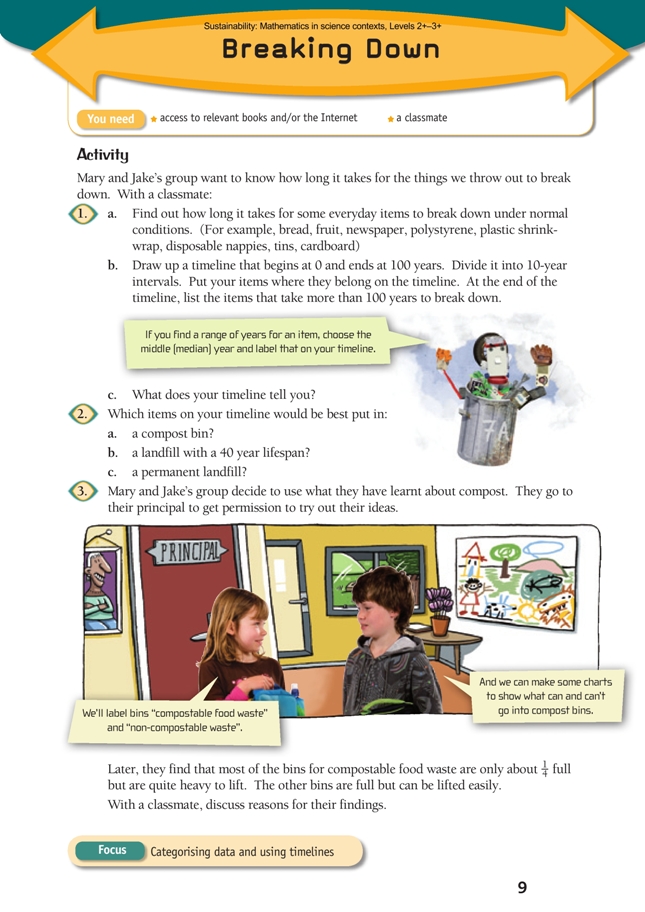
3. Compostable items commonly disposed of at school would include food scraps (except for
meat and dairy food, which shouldn’t go into a compost bin). Food scraps are more dense than
the paper and plastic that would make up most of what is in the non-compostable waste bins.