This is a level 3 algebra strand activity from the Figure It Out series.
A PDF of the student activity is included.

Click on the image to enlarge it. Click again to close. Download PDF (416 KB)
use a graph to show relationships in sequential patterns
a digit wheel
FIO, Level 3, Algebra, Biscuit Binge, pages 14-15
square grid paper
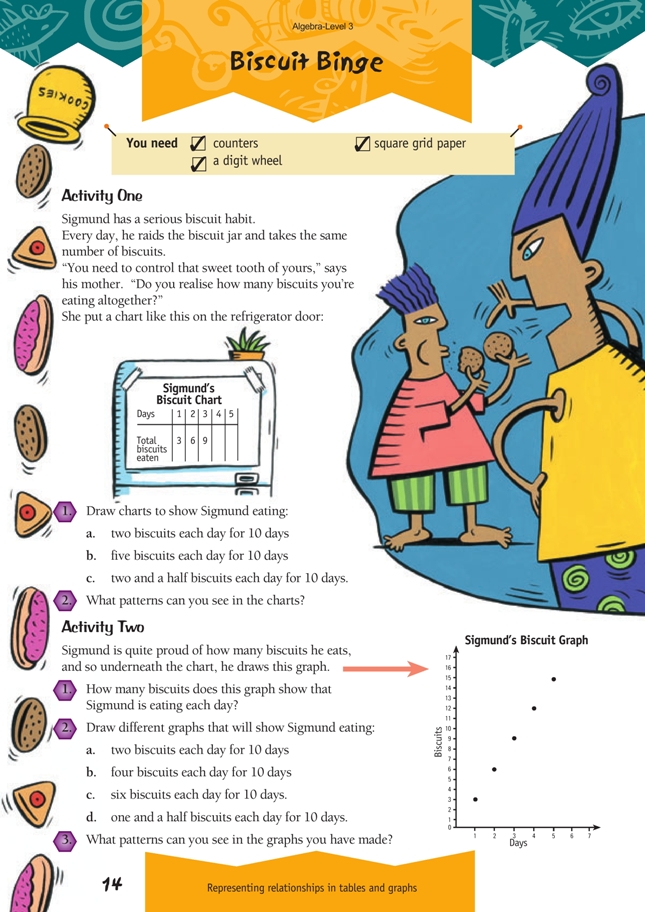
Activity One
Encourage students to use a spreadsheet to develop their charts. Some students may compare the charts and notice that if one person ate two biscuits a day and another ate three a day, then the answers are the same as if one person ate five biscuits a day. Or they may notice that the totals for two and a half biscuits a day are half the totals for five biscuits a day.
Activity Two
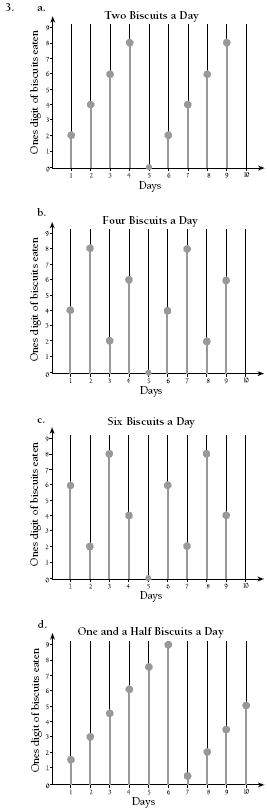
You may need to remind students that usually the constant variable (in this case, the days) is on the x axis (the horizontal axis) and the variable that changes is shown on the y axis (the vertical axis).
Students will need to vary the numbers on the y axis so the graphs are a manageable size.
Activity Three
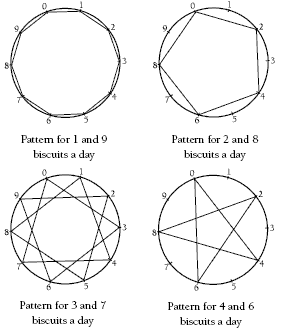
This activity shows different ways of recording patterns. Because they are on a base of 10, the patterns can be explained as multiples of the rate per day, for example, 0, 3, 6, 9, 12, 15, 18, 21, 24, and 30. The pattern has gone around the digit wheel three times before each digit is visited.
The number visited is the ones digit of the total number of biscuits eaten.
Make sure that students understand how the digit wheel works. You could work through question 1 with them. First, complete Sigmund’s three-biscuit-a-day chart.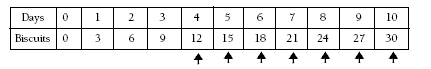
Ask students to identify the ones digits in the biscuit totals. The ones digit pattern is: 0, 3, 6, 9, 2, 5, 8, 1, 4, 7, 0.
You could suggest that students use this method to complete the digit wheel: “Start at the 0 on the digit wheel. Draw a line to the next digit in the pattern (3). Draw another line to the next digit (6). Continue until you reach the end of the digit pattern.”
Encourage students to explain the process in their own words and compare the patterns they have developed on the digit wheel for question 2. Useful questions include:
“How many times do you have to go around each digit wheel before you have touched each digit?”
“What do you notice about the wheels for even numbers of biscuits eaten each day? Can you explain why this happens?”
“Which biscuit-a-day patterns eventually touch all the numbers?”
“Can you explain the five-biscuit-a-day pattern?”
Answers to Activity
Activity One
1.
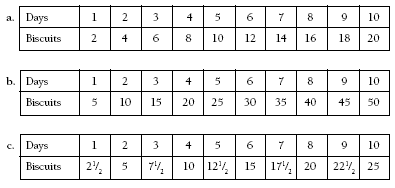
2. Answers will vary. A possible answer is: The total of the biscuits increases evenly in each chart by the number of biscuits eaten that day. To find the total number of biscuits eaten, multiply the number of days by the number of biscuits eaten each day.
Activity Two
1. 3 biscuits each day
2. Numbers along the vertical axis will vary. Some
possible graphs are:
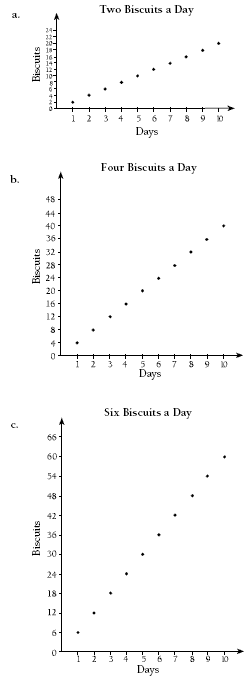
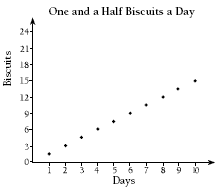
3. Answers will vary. A possible answer is: The points on the graphs are evenly spaced according to the number of biscuits eaten that day. The points lie on a straight line. This is because the difference between points is the same (for example, in b, 4 up for every 1 across).
Activity Three
1.
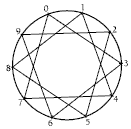
The 3-biscuits-a-day pattern creates a star polygon.
You may see other patterns.
2. Answers will vary. Some examples (using the ones digit of the biscuit numbers):