This is a level 3 activity from the Figure It Out series.
A PDF of the student activity is included.
Click on the image to enlarge it. Click again to close. Download PDF (721 KB)
Statistical thinking involves the exploration and use of patterns and relationships in data. There are four key processes:
- describing data – connecting the information in a table or graph with a real-life context
- organising and reducing data – ordering, grouping, and summarising data
- representing data – creating visual representations
- analysing and interpreting data – recognising patterns and trends and using them to make inferences and predictions.
In these activities, the students explore data related to the durability of plastic bags.
2 types of plastic bags
twine
In these activities, students interpret the results of a statistical investigation and then conduct a similar investigation themselves. For their investigation, have them discuss and then apply the PPDAC statistical enquiry cycle: problem, plan, data, analysis, conclusion. (See www.census@school.org.nz)
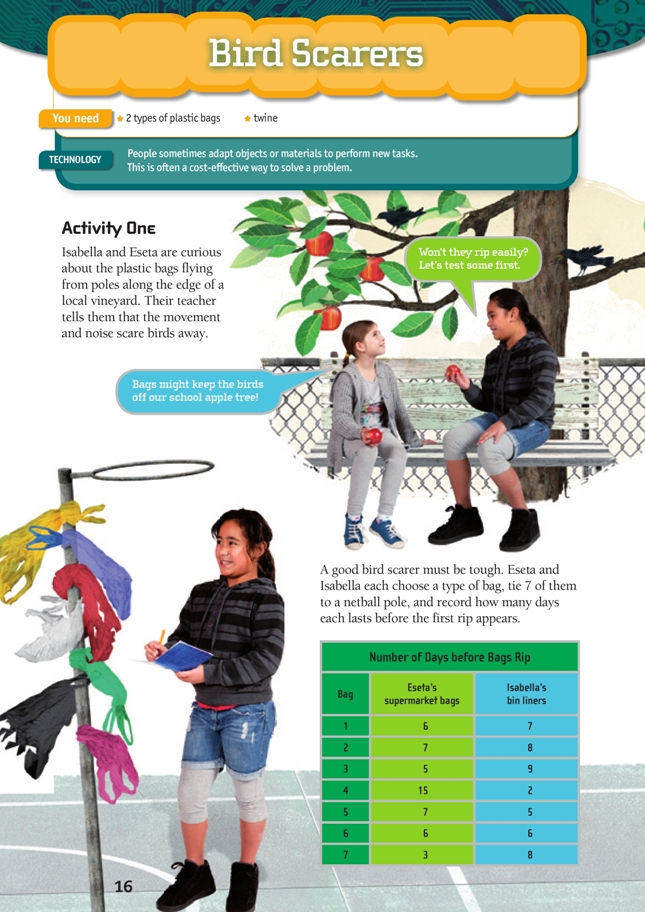
Activity One
It can be hard to see a pattern within a list of numbers, but when the information is displayed as a dot plot, patterns within the data are revealed. A dot plot shows how the data is grouped and whether there are any outliers.
Understanding variation is central to the development of statistical thinking. Variation occurs in every aspect of life: the amount of cereal in a bowl, the time it takes to get to school, the weather. Most students will have an intuitive understanding of variation. They will understand, for example, that not all 10-year-olds are exactly the same height. Whatever the source of the data, some variation is to be expected. It would be unusual if all the bags in the investigation had ripped at the same time unless this was the result of extreme weather.
Although variation is to be expected, it can be useful to compare the amount of variation within two data sets. For example, there is greater variation in the supermarket bag data than in the bin liner data. This tells us that the bin liners were more consistent in durability than the supermarket bags. (Note that, in reality, we would want a much larger sample before making such comparisons.)
Outliers are data values that are significantly smaller or larger than the rest of the data. When analysing data, it is important to treat outliers with care. It can be tempting to dismiss them as abnormalities, but an examination of outliers can provide useful information. Points to consider in this example include:
- When there are only a small number of “trials” (in this case, bags), it is hard to tell whether an apparently large or small value is an outlier. Because the sample was so small, the bag that only lasted 2 days has a big impact on our assessment of the durability of the bin liners. If 100 bags had been used and 1 bag lasted for a significantly longer or shorter time than the others, we could call this bag an outlier with much greater confidence.
- There may be a simple explanation for the outlier. For example, it may have been fl awed in some way. Was it a lower quality bag to begin with? Was it attached to the pole differently? Was it lower or higher to the ground? Was it in the sun or the shade? Did it snag on something? Investigating these possible causes may provide useful information that can be used to refine the bird scarers.
Activity Two
It is important to keep in mind the purpose of the investigation. Isabella and Eseta investigated one aspect of the bird scarers, namely, their durability. The question they posed informed the way they set about gathering data. Discuss with the students how they could gather data related to other attributes of effective bird scarers.
See Chilling Out in Measurement, Figure It Out, Level 4+, for an activity involving students making an anemometer and measuring wind speed. See also Wind Chill in Energy, Figure It Out, Levels 3+–4+.
Related information:
- www.niwa.co.nz/news-and-publications/publications/all/wa/14-4/wind
- www.eeca.govt.nz/efficient-and-renewable-energy/renewable-energy/maps/wind
By learning how to interpret statistical information, students are developing the key competency using language, symbols, and texts.
Technology-related student activities
Suggesting adaptations for products or objects is a useful exercise for students, as imagination and creativity are required.
- Provide a range of everyday objects for students to suggest adaptations – for example, a glass, a mirror, a shoe box. (Note: objects can be changed to achieve desired results. For example, an old plate could be broken up to make a mosaic.)
- Students research examples of accidental inventions (these are related to adaptation, where serendipity is recognised and acted upon).
- Students think of a desired outcome and then brainstorm how unusual objects could be used to produce that outcome, such as a plastic-bag bird scarer.
Exploring the technology-related context
People often use objects and materials in creative and new ways. They recognise that the performance properties of a particular object may be suitable to solve a different problem or meet a new need. This could save time and money and could even benefit the environment.
Answers
Activity One
1. a. 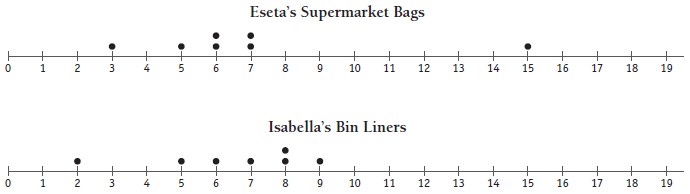
b. i. The bag that lasted the longest was a supermarket bag. However, if we ignore this bag and the bin liner that only lasted 2 days, it does seem that, overall, the bin liners lasted a bit longer than the supermarket bags.
ii. The statement is true. The worst bin liner only lasted 2 days, and all the supermarket bags lasted longer than this.
c. Answers will vary depending on how much notice you take of the ones that are different from most of the rest – the best supermarket bag (15 days) and the worst bin liner (2 days). Overall, bin liners were stronger and there was less variation in how long they lasted. There was much more variation in the supermarket bags and, apart from the 15-day one, they lasted fewer days.
2. a. The supermarket bag that lasted 15 days is an outlier because it lasted so much longer. The bin liner that only lasted 2 days could also be an outlier. Perhaps it was faulty.
b. Answers will vary. Isabella and Eseta might choose to ignore the bag that lasted 15 days on the grounds that it was unusually strong, and therefore not typical. But the experiment didn’t use many bags, so the outliers may not be as unusual as they look. (In other words, if they had trialled a lot more bags, they would have had a clearer picture.)
Activity Two
1. a. Practical activity
b. Other factors besides strength might include noise, movement, whether the bags get easily tangled, or their position on the pole (it might be windier at the top). (You might also want to check that you only choose bags that don’t already have a hole in the bottom of them.)
c. Decisions will vary.