This is a level 4 statistics activity from the Figure It Out series.
A PDF of the student activity is included.
Click on the image to enlarge it. Click again to close. Download PDF (1154 KB)
create a bar graph
interpret information from a table/graph
evaluate a classmate's statement
This diagram shows the areas of Statistics involved in this activity.
![]()
The bottom half of the diagram represents the 5 stages of the PPDAC (Problem, Plan, Data, Analysis, Conclusion) statistics investigation cycle.
Statistical Ideas
Billboards involves the following statistical ideas: using the PPDAC cycle, evaluating statements made by others, and using multivariate data sets and clustered bar graphs.
A computer spreadsheet/graphing program (optional)
Classmates
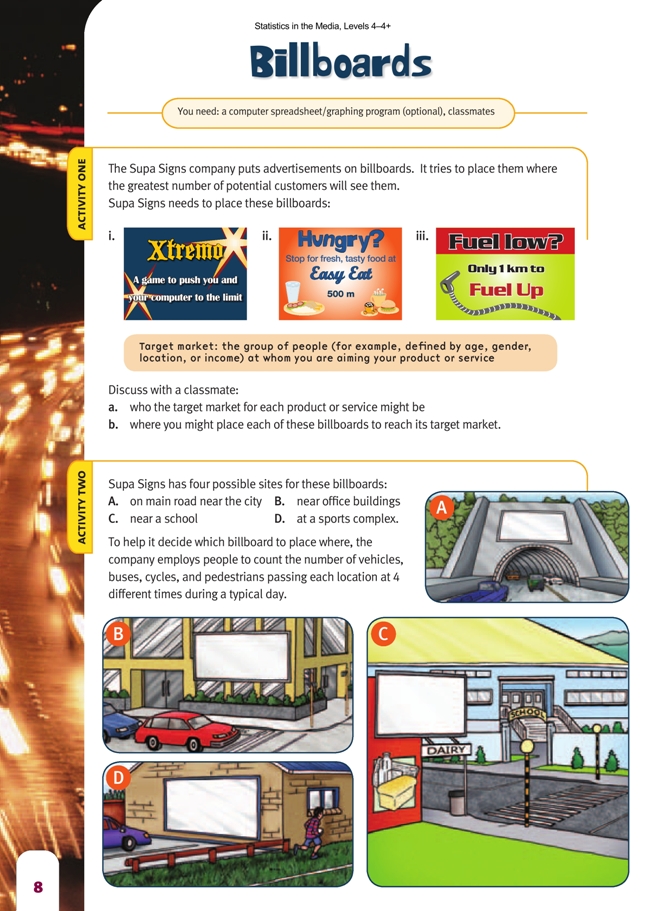
Activity One
A good starting point would be to relate these questions to the students’ own world. For each billboard, ask: Who do you know who would be interested in this billboard? and Where in our school neighbourhood would you want to place this billboard for these people to see it?
Activity Two
Encourage your students to always ask questions of data that is presented to them (even if there are no firm answers). For example, they might ask: “How was the data collected?” “What about between 7 a.m. and 8 a.m.?” “Why is the last category more than 1 hour?”
When the students are checking the statements that other students have made, remind them to make their criticism fair and polite. If they think a particular statement is not fi rmly based on the data, they could discuss with the classmate what they did base the statement on and whether that data could be interpreted differently.
For question 2, students are making recommendations on behalf of Supa Signs. However, you could also encourage them to write a report in the format Supa Signs might give the owner of each product. They can use the graphs if they feel they lend weight to the recommendations. As well as the data and findings, the report may
include factors such as visibility, busy roads (so drivers need to concentrate on their driving), or anything else is in those areas competing for driver, passenger, or passer-by attention.
Extension
Students could design their own billboards for a product targeted at schoolchildren. They could then examine traffic and pedestrian flows near the school and use the data to select an appropriate location. Alternatively, students could examine traffic and pedestrian flows for the location of an external school sign/noticeboard.
Answers to Activities
Activity One
a.–b. Possible answers include:
i. Target market: people with access to computers who like playing games on them
Location of sign: near a school (to catch the attention of students, associated adults, and passing traffic); on a city site with lots of passing traffic (vehicles and pedestrians); near a shopping complex or a shop that sells computer games
ii. Target market: travellers ready for a meal break; people on work breaks or those going to and from work who might decide to stop and eat on the way; shift workers on their way to or from work; people going into or out of the city for shopping or other business.
Location of sign: within easy reach of a convenient place to pull out of traffi c on way in or out of the city; near some large businesses employing many people; near big employers of shift workers. (The distance on the sign would need to match the
distance from the location chosen.)
iii. Target market: people travelling in or out of the city; someone prompted by the sign to realise their fuel is low; busy people who don’t want to queue at an
inner-city service station Location of sign: close to the service station but
far enough away to give drivers time to look at their gauges and make a safe exit off the road; at a convenient place to pull out of traffic on way in or out of the city.
Activity Two
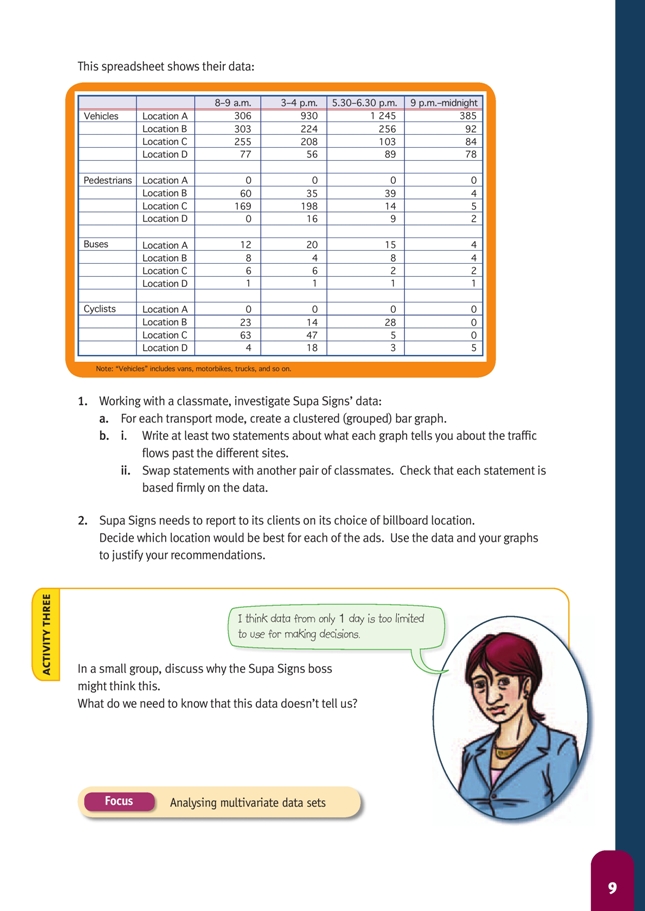
1a.
b. i. Statements will vary. For example:
Vehicles graph:
• Location A’s peak fl ow is between 5.30 and 6.30 p.m. (presumably because of people going home from work), and it has a higher flow than other locations at other times. Location A has by far the highest overall vehicle flow.
• Location B has a reasonable flow of vehicles all day up to 6.30 p.m., which fi ts with most city working/shopping hours.
• Location C has its best vehicle fl ow between 8 and 9 a.m. and between 3 and 4 p.m., which relate to school hours.
• Location D has a low flow at all times.
Pedestrians graph:
• Location A has no pedestrian traffic.
• Location B has a steady flow all day but little at night.
• Location C has by far the highest overall pedestrian fl ow of all the locations, although this is greatest between 8 and 9 a.m. and between 3 and 4 p.m. (which relate to school hours).
• Location D has very low pedestrian traffic at all times.
Buses graph:
• Location A has by far the best flows between 3 p.m. and 6.30 p.m. and the highest bus flow overall.
• Location B has more buses between 8 and 9 a.m. and between 5.30 and 6.30 p.m. than at other times.
• Location C has more buses at the start and finish of school than at other times.
• Location D has few buses passing at any time.
Cyclists graph:
• Location C has by far the best flow at the start and fi nish of school but no flow at all between 9 p.m. and midnight.
• Location D is the only location that has cyclist traffic at all times, but the numbers are low.
• Some locations have no cyclist traffic at certain times. One location has no cyclists at all.
b. ii. Discussion will vary.
2. Use of data and graphs will vary. Possible recommendations include:
Computer game ad: position C, which has reasonable vehicles and buses’ traffi c fl ow and high pedestrian and cycle numbers between 8 and 9 a.m. and 3 and 4 p.m.
If the ad is partly aimed at schoolchildren or associated adults, the location near a school is suitable.
Food ad: position B. It has reasonable numbers of vehicles, cyclists, and pedestrians between 5.30 and 6.30 p.m., which is near evening meal time; the traffic
will probably be slower at that busier time because of the traffic lights, and it may be on people’s way home from work.
Petrol station: position A. It’s a main road in or out of the city and has the highest vehicle traffic of all the locations.
Activity Three
Discussion will vary. It isn’t wise to base a decision on data collected on 1 day only because data collected on different days of the week or at other times of the day may lead to different recommendations.
The data doesn’t tell us about factors such as the speed of traffic, the level of concentration the drivers need at those locations, how well lit the billboards are at night, or other possible distractions for those who pass by.
Key Competencies
Billboards can be used to develop these key competencies:
• thinking: exploring and using patterns and relationships in data, and making decisions
• using language, symbols, and texts: communicating fi ndings, using ICT as appropriate, interpreting visual information such as graphs and diagrams, and demonstrating statistical literacy
• relating to others: sharing ideas and communicating thinking
• participating and contributing: working in pairs with both people participating