This is a level 3 statistics activity from the Figure It Out series.
A PDF of the student activity is included.
Click on the image to enlarge it. Click again to close. Download PDF (2951 KB)
categorise data
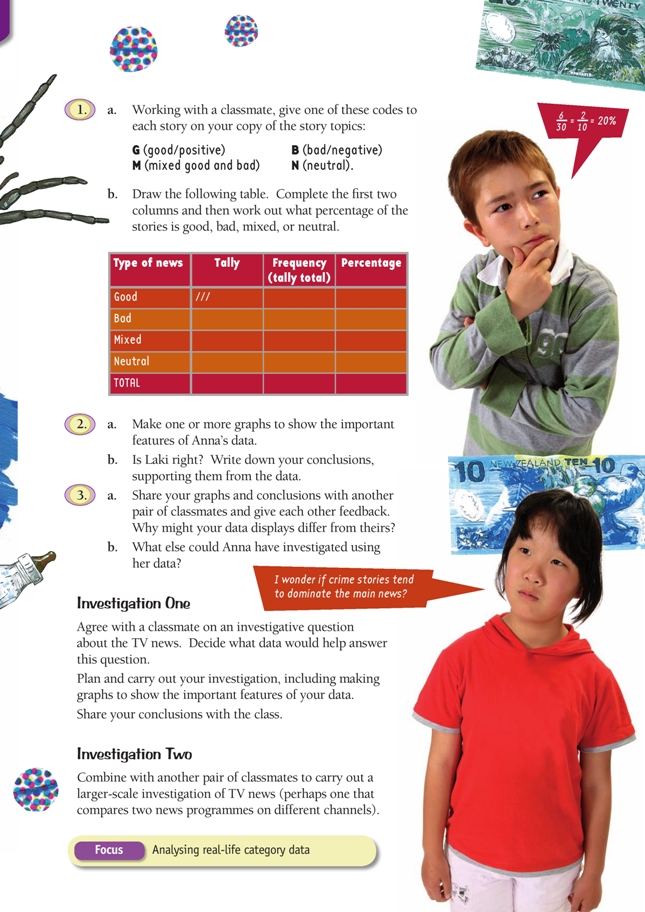
calculate percentages
construct a graph
make a conclusion from the data
This diagram shows the areas of Statistics involved in this activity.
.gif)
The bottom half of the diagram represents the 5 stages of the PPDAC (Problem, Plan, Data, Analysis, Conclusion) statistics investigation cycle.
Statistical Ideas
Bad News? involves the following statistical ideas: classifying category data, using tally charts, communicating findings using graphs, repeating investigations, and using the PPDAC cycle.
As with Dinner Time Ads, this activity demonstrates that “real” data can be complex and difficult to categorise.
A computer spreadsheet/graphing program (optional)
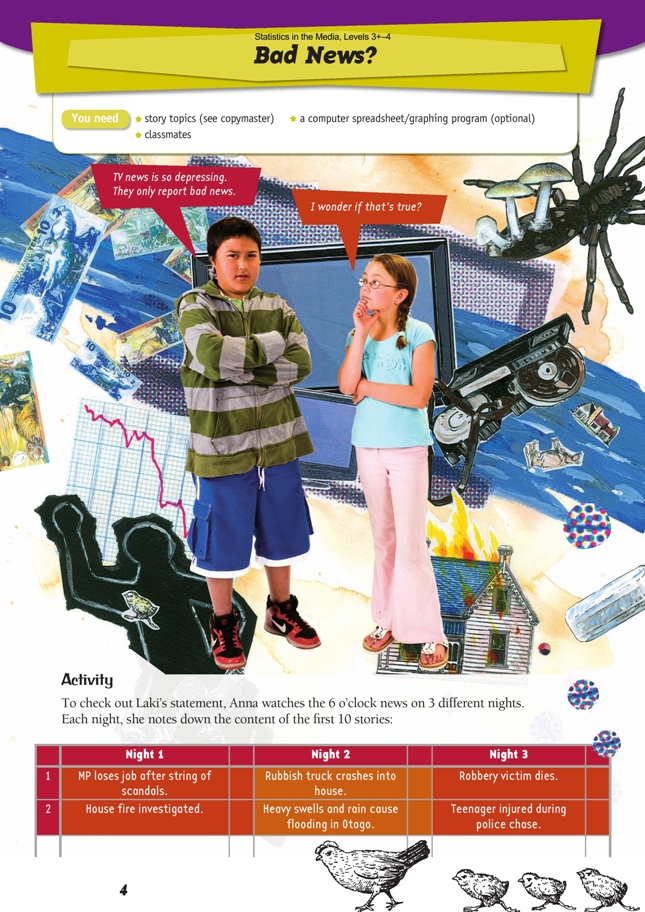
FIO, Levels 3+ -4, Statistics in the Media, Bad News? pages 4-5
Classmates
Before the students begin their analysis, encourage them to try and reach a shared understanding of what constitutes good, bad, mixed, and neutral news, illustrating each category with exemplars. This process prepares the groundwork for determining appropriate variables and measures (a level 5 achievement objective). In this instance, the variable would be the type of news and the measures would be good, bad, mixed, and neutral. Only if those involved have similar understandings is it possible to pool data and compare the findings for different samples.
Although a standard bar graph is given as an example in the answers for question 2a, encourage the students to invent their own graphs to display the information.
For question 2b, Laki is right according to Anna’s data, but the sample (1 channel, 3 nights) is too small to support a defi nite conclusion. A larger data-gathering exercise, perhaps spread over 20 nights (and different channels, as suggested later), would provide a firmer foundation on which to draw a conclusion.
When students share their graphs and conclusions for question 3, they should also provide each other with feedback on how effectively their data displays communicate their findings.
Investigation One
Investigative questions are likely to be summary questions. “I wonder” questions can be phrased as suitable investigative questions. For example, “I wonder if most bad news stories are about crime?” could become the investigative question “What are bad news stories typically about?”
The PPDAC cycle starts with the problem, followed by the plan. For any investigation, encourage your students to settle on the question(s) they want to answer and then collate (or find) the data that answers the question(s). To continue the PPDAC cycle, have students share their findings with other classmates, who can help them evaluate how convincingly they have answered their investigative question and how effectively their graphs communicate the important information.
Investigation Two
In this investigation, two different channels could be compared, as could weekend or weeknight news. Is the last news item always positive? Students might like to develop and use a classification system (for example, political, economic, crime, accident, health, human interest, weather, natural disaster) as a basis for their investigation.
Answers to Activity
1. a. Coding will vary. For example, “Death toll in bridge collapse not as high as fi rst
thought” could be either B or M (the collapse and deaths are bad news, but the
fact that the toll is “not as high as first thought” is good news).
b. The table will vary depending on your answers to a. A possible table is:
2. a. Types of graphs will vary. For example, you could use standard graphs such as a bar graph, a strip graph, or a dot plot (but not a pie chart as it would be difficult to
show such small numbers or percentages on it) or you could invent a graph. The
shape of the graphs will depend on your answers for 1b. A possible bar graph is:
b. Comments will vary. In the analysis given for question 1b, only 1 out of the 30
stories is classified as good and only 1 as neutral, supporting Laki’s view that there
is very little good news. However, the data covers only 3 nights. The investigation
would have to be extended to confirm
3. a. Discussion will vary. Data displays will differ depending on how the stories have
been categorised and the types of graph used.
b. Answers will vary. For example, Anna could have investigated what proportion of
stories were about weather-related or natural disasters, crime, or politics or what
proportion were current news stories versus old news with a new bit added.
Investigation One
After you decided on your investigative question, your planning would need to have included basic details such as which news data you would collect data from, on which nights, and for how many nights. The actual data collected will depend on your
investigative question. That data will determine the best kind of graph to show the important features.
Investigation Two
Investigations and findings will vary.
Key Competencies
Bad News? can be used to develop these key competencies:
• thinking: investigating, interpreting, designing investigations, demonstrating statistical
literacy
• using language, symbols, and texts: communicating fi ndings, interpreting visual
representations such as graphs
• relating to others: working in groups, collaborating
• managing self: seeking understanding.