This is a level (3+ to 4+) mathematics in science contexts activity from the Figure It Out series.
A PDF of the student activity is included.

Click on the image to enlarge it. Click again to close. Download PDF (981 KB)
Students will:
- perform calculations with percentages
- gather and interpret statistical data.
Students should discover that:
- they can create a statistical map that shows the air pollution of different parts of the school environment.
a map of the school
cardboard
cling film
petroleum jelly
a hand lens or microscope
a candle
a mirror or smooth ceramic mug
classmates
FIO, Using Resources, Levels 3+-4+, The Air We Breathe, pages 12 - 13
Preparation and points to note
Ensure that protocols are clearly established and proper safety procedures in place before doing any
experiment that involves lighting candles. In this investigation of air pollution, the students need to make sense of information, draw on their own experiences, and explain their ideas, all of which use and further develop the key competency thinking.
For the demonstration in Activity One, a ceramic tile or a plain white coffee mug is a good substitute for a mirror.
For Activity Two, you will need a reasonably accurate map of the school. If one is not already available, use a satellite view from, for example, Google Earth, Google Maps, Terralink, or your local body website.
The collectors should hang undisturbed for about a week. Decide on a good time of year, and alert the rest of the school to the investigation and the importance of leaving the collectors undisturbed. Work with the students to fi nd ways to protect the collectors from rain, accidental removal, or interference.
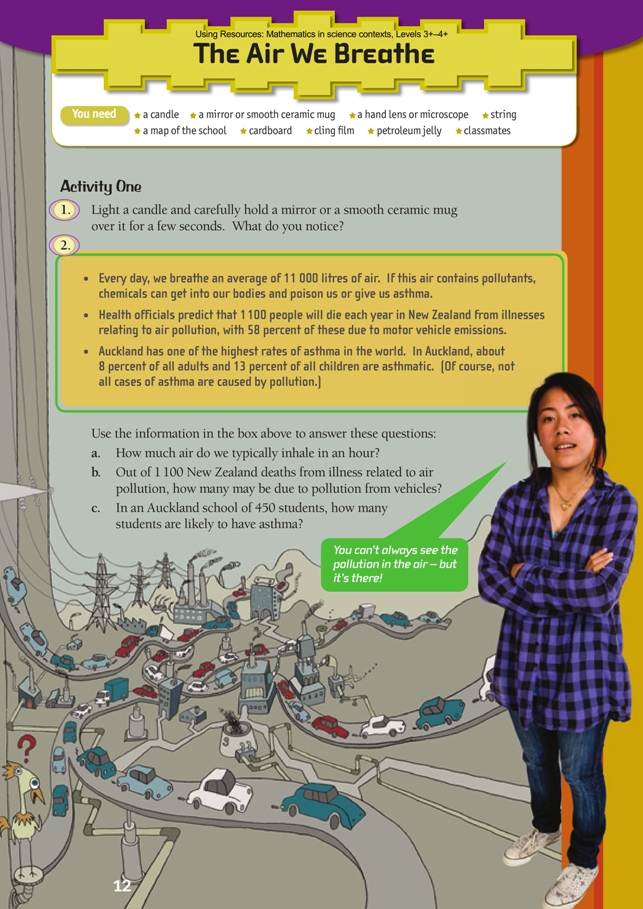
Note that pollution is not always visible to the naked eye. Make sure the students understand that even if they don’t see pollution, it may be there (the candle demonstration will hopefully make this clear). A common misconception is that only those cars that are emitting black smoke are polluters. Cars produce at least some carbon monoxide and nitrous oxide even if recently tuned, and landfills emit methane (another invisible greenhouse gas).
Particulate pollution (and experimental results) will vary depending on the location in the school, weather conditions, and the time of year. For example, the presence of pollens and other naturally occurring particles is very seasonal, as is the operation of the school boiler. Minute particles can travel a long way from their source, depending on wind direction and air currents.
Points of entry: Mathematics
Relate the statistics on page 12 of the students’ book to the students themselves. For example, ask: How many students in the class suffer from asthma or hay fever? How does this compare with the Auckland data? Would the area in which our school is situated be likely to have more or less vehicle-generated pollution than Auckland?
Discuss the application of rates (for example, “13 out of every 100”) and rules of thumb (for example, Pareto’s rule). Ask: Can we be sure that 58.5 students in an Auckland school of 450 have asthma? (No.) So what is the value of a statistic like this? Statistics such as this enable us to make reasonable estimates of incidence, but they give no certainty – for example, a small Auckland school might be entirely asthma-free (while very unlikely, this is not impossible).
Reliable statistical rates are based on large-scale surveying/sampling. Relate this to the present activity. Sampling is necessary because it is impractical to collect pollution data for every square centimetre of the school. But the sampling is small-scale and the methodology fairly crude, so the results will be tentative and limited in their application.
Ideally, this activity would be done as a whole-class activity. If so, challenge the students to come up with a way of systematically parcelling out the territory to be covered. They should also be challenged to predict the areas of the school that will have the least and greatest particulate counts. They should record these predictions.
Students will need to use their estimation skills when comparing and matching samples. Different students may judge samples differently, so you may wish to do a calibration exercise or have a group of students agree on each reading.
When the results from all groups have been collected and collated, the students could make a “heat” map in which high-pollution areas are coloured red and low-pollution areas blue. Ask: What are the implications, if any, of your findings? Who could be interested in a presentation of these findings?
Points of entry: Science
Ask the students where and when they have been able to observe air pollution. Have them brainstorm probable local sources of pollution. (Particulate air pollution will be heaviest near heavy traffic, machinery exhaust outlets, or close to naturally occurring sources, such as wheat fields, orchards, and flowering plants.)
Highlight what particles are and their sources. In Activity One, question 1, the candle should appear to be non-polluting when burning in open air, but it should blacken the mirror, mug, or tile when held over the flame. The students should observe soot; if the tile or mirror is cold, they should be able to observe condensation as well – incomplete combustion creates the soot and carbon monoxide. (Complete combustion, yielding only carbon dioxide and water, is almost impossible to achieve.)
This activity reinforces the use of the scientific method for testing predictions. Encourage your students to think logically about where and why they will place the collectors. They should be placed in a variety of locations: inside, outside, near pollution sources (pollen-shedding trees, heater vents, car exhausts), and in clean areas. Confirm that they will be suitably sheltered (weather conditions may be a factor!) and secure for a week. Also, make sure that there is a control collector in a place that is isolated and still (perhaps a classroom cupboard). If the students are very motivated, suggest they take some collectors home and use them to gather additional data.
Have the students test the predictions against the data and link the findings back to the original ideas: Why is site X the most polluted? Discuss the results as a class. Ask: Are there actions that you can or should take? Do you need to do further research first?
Answers
Activity One
1. Practical activity. You should notice some soot on the mirror or mug.
2. a. About 460 litres (L). (11 000 L ÷ 24 hrs = 458.3 L)
b. About 640. (58% of 1 100 = 638)
c. About 60. (13% of 450 = 58.5) (Answers have been rounded to reflect the approximate nature of the given statistics.)
Activity Two
1. a.–b. Answers will vary, but pollution is likely to be greatest in locations close to busy roads, sources of dust (such as an unsealed road), or plants or trees (such as pines) that are releasing lots of pollen.
2. Practical activity. Predictions will vary, but you should have good reasons for them. For example, it’s likely that a collector next to a heating vent will have more particles on it than a collector hung in a clean, unused cupboard.
3. a.–c. Results and comments will vary.