This is a level 3 statistics activity from the Figure It Out series.
A PDF of the student activity is included.
Click on the image to enlarge it. Click again to close. Download PDF (1495 KB)
interpret information from a graph
write an investigative question
collect and collate data
display data on a graph
make conclusions
This diagram shows the areas of Statistics involved in this activity.
.gif)
The bottom half of the diagram represents the 5 stages of the PPDAC (Problem, Plan, Data, Analysis, Conclusion) statistics investigation cycle.
Statistical Ideas
Ad Mad involves the following statistical ideas: interpreting clustered bar graphs, using the PPDAC cycle, evaluating the effectiveness of data displays, and comparing within and between data sets.
A computer spreadsheet/graphing program (optional)
Classmates
Activity One
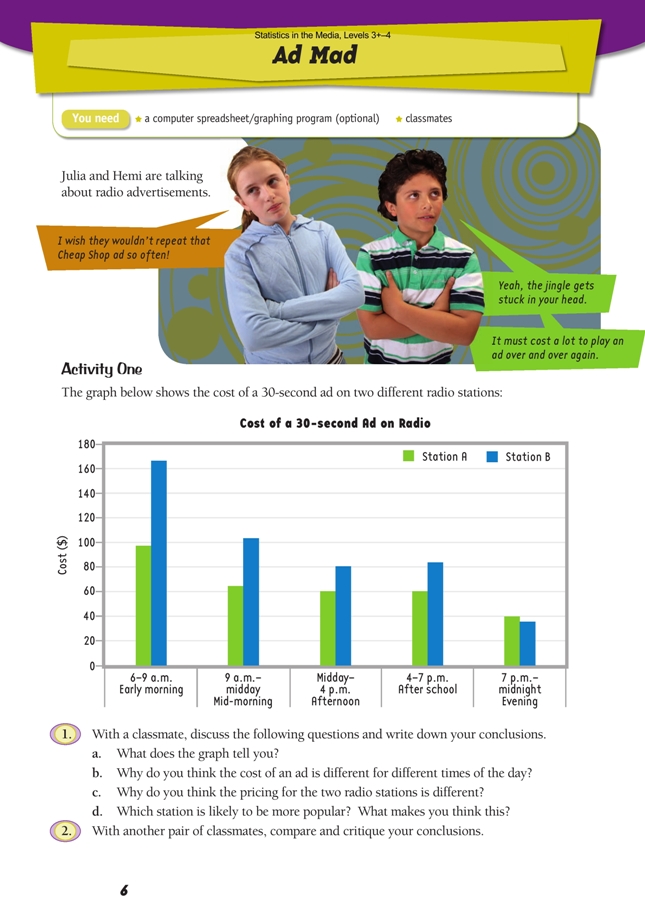
A clustered bar graph is, in effect, two or more bar graphs sharing a common set of axes and allows comparisons to be made both within and between data sets. This can be confusing for some students.
The general trend for both radio stations is that the cost of an advertisement reduces as the day progresses. The cost is lowest of all in the evening slot, when both stations charge less than $40.
Station A is cheaper than station B for all times except after 7 p.m. This suggests that, while station B is considerably more popular during the day, station A has more listeners in the evening. Perhaps it has a particularly good presenter at that time, someone who has developed a strong personal following. Ask your students what might explain this reversal of popularity in the evenings. As noted in the Answers, the data used for the graphs is an approximation only.
The students could find similar data for themselves if required.
Investigation
Students need to be guided through the PPDAC cycle when developing their own investigations. One way to do this is to brainstorm “I wonder” questions and other ideas for investigation. These will need to be teased out to form appropriate investigative questions. The students are likely to need a lot of support at the problem phase of the cycle. Modelling and conferencing will assist the students in framing their investigative questions before they embark on the planning and data collection phases.
The students need to decide if they will survey one radio station at different times of the day, different stations at the same time of the day, or different stations at different times of the day (a more ambitious undertaking). They also need to decide how long they will listen for and what data they will collect. Encourage them to collect data on a wider selection of variables than the one(s) they need to answer their investigative question. This will allow for further analysis later on and for the answering of other questions.
Activity Two
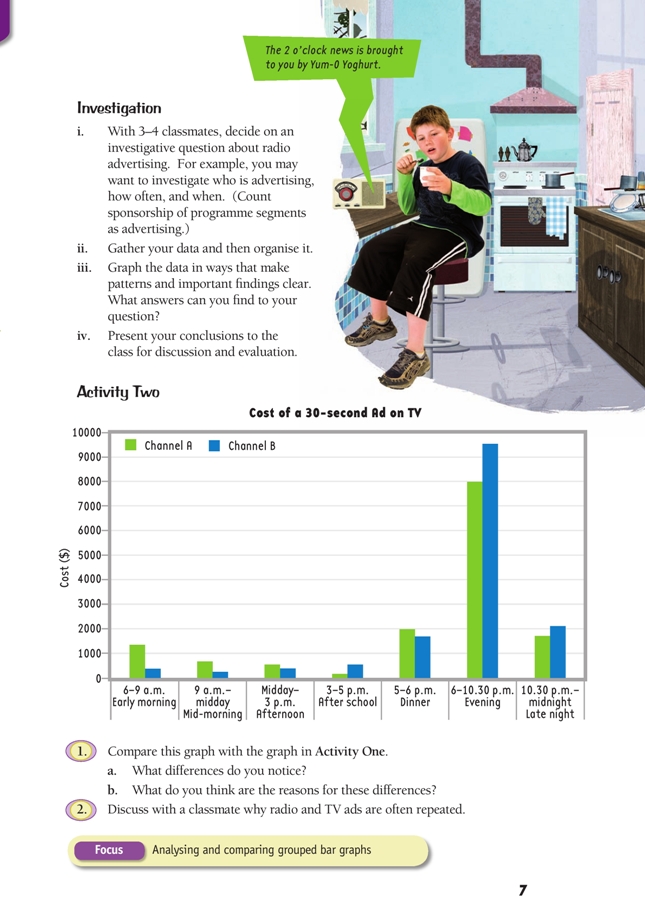
It is important that the students realise that the two graphs in Ad Mad use very different scales on the vertical (cost) axis and that the categories on the horizontal axis are not exactly the same. When two graphs are to be compared, it is usually preferable to draw them to the same scale. However, the costs for radio are so much less than those for TV that a common scale would almost obliterate the radio costs:
Extension
Students could carry out an investigation into TV advertising as they did earlier for radio advertising. They could share their graphs and conclusions with other groups or present them to the class. When your students are giving feedback to others (for example, on aspects such as the use of the PPDAC cycle, the quality of the presentation, and the appropriateness and clarity of the graphs), encourage them to look for the positive features and make constructive suggestions for improvements.
You could also have the students look at a TV guide (magazine or newspaper) to compare scheduling information with the ad prices given in Activity Two for various times. Have them find out which TV programmes are likely to earn the TV channel the most revenue (and how much), based on the information in the TV graph. They will also need to know how long ad breaks are in total and whether the length of ad breaks varies at different times of the day. Have them compare this information to the TV ratings found in the newspaper. Ask them what they notice.
Answers to Activity
Activity One
1. a. The graph shows how much a 30-second ad on two different radio stations costs at different times of the day. (Note that the fi gures for both radio and TV are not from actual New Zealand radio or TV companies but are based on general
information available at the time of writing.) For each station, the graph
generally slopes downwards, meaning that ads cost more in the mornings and less in
the afternoons and evenings. This difference is greater for station B than for station A. Except for the evening slot, ads on radio station B cost more than they do
for station A (the price difference is especially noticeable in the early
morning).
b. More people listen to the radio in the morning (for example, getting ready for,
or on the way to, school or work). When there are more listeners, a station can
charge more for its ads.
c. Station A probably charges less (except in the evening) because it has fewer listeners.
d. Station B because the advertisers pay more to get their message out than they do on station A. This suggests that the expected audience is bigger than station A’s.
2. Discussion will vary.
Investigation
i.–iv. Investigations and fi ndings will vary.
Activity Two
1. a. Differences you may notice include:
• It is much more expensive to advertise on TV than on radio.
• On radio, the most expensive time to advertise is the morning, whereas on
TV, the most expensive time is the evening.
• The price difference between day and evening advertising on TV is huge, whereas on radio, the difference (both actual and relative) is much smaller.
• While the morning time slots for radio and TV are identical, there are 5 TV time slots after midday compared with 3 for radio.
b. Answers will vary. For most adults, TV is evening entertainment, whereas during
the day, many listen to the radio while they do other things (for example, drive to
and from work or do housework). Unlike most TV, listening to the radio is
something that you can do while doing something else. Because far more people
watch TV in the evening, TV companies can charge more for advertising.
The after-school audience for TV is mainly children. Children’s spending power is
not as high as that of adults, so advertisers are not charged as much as later in the
day. (However, advertisers are also interested in advertising to children
because children can often persuade their parents to buy a product or service and
because they will one day be able to make their own purchasing decisions.)
2. Answers may include these ideas:
• Radio is a relatively cheap medium, so advertisers can afford to repeat ads.
• Radio and TV companies give discounts for repeats.
• Repetition gives the ads greater impact
• The ads become familiar to the listeners (some ads are also shown in a shortened
version, but the listeners/viewers still recall the whole ad).
• Having an ad repeated is cheaper than making a new one.
Key Competencies
Ad Mad can be used to develop these key competencies:
• thinking: designing investigations, exploring and using patterns and relationships in data
• using language, symbols, and texts: communicating fi ndings, interpreting visual
representations such as graphs, diagrams
• relating to others: collaborating, working in groups
• managing self: seeking understanding
• participating and contributing: working in groups with everyone participating, sharing equipment and/or resources.