This is a level 4 statistics activity from the Figure It Out series.
A PDF of the student activity is included.
Click on the image to enlarge it. Click again to close. Download PDF (868 KB)
find all possible outcomes
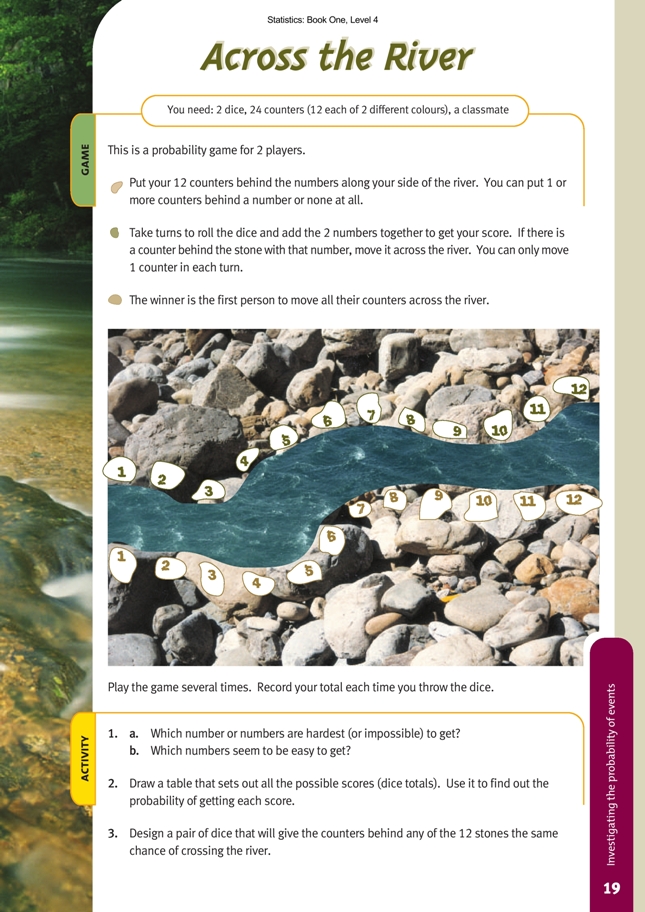
explore outcomes in a probability game
find the probability of the outcome
design a fair dice for the game
2 dice
24 counters (12 each of 2 different colours)
A classmate
Students can play this game even if they have little understanding of probability. If observant, they will discover that the different totals that can be obtained from throwing two dice are not equally likely. You could discuss why this might be the case. The students can then use either the table suggested in question 2 or a tree diagram as suggested by the curriculum to provide an answer to the question.
Even students who understand some probability can have trouble seeing that there are 36 different ways to get the totals 2 to 12. Discuss this, along with the idea that there is more than one way to get a total such as 7. You could point out that if you get a 1 on the first roll, you can get the desired total (7) by getting a 6 on the second roll. If you get a 2 on the first roll, it could be followed by a 5 on the second. A 3 could be followed by a 4, or a 4 by a 3. In fact, no matter what you get on the first roll, you have a chance of getting a total of 7 from the two rolls.
Once these facts have been established, you can ask, “What is the probability of getting a total of 7?” The answer can be recorded as a statement (6 out of 36) or as a fraction (6/36 or 1/6 ).
In question 3, the students will first need to realise that they must get each total (1–12) the same number of times. Because there are 36 ways to get a total and there are 12 different totals, each one will have to occur 3 times in a table. Even when they have realised this, they are unlikely to find a solution simply by trial and improvement.
The notes for Dodgy Dice (page 22 of the students’ book) explain that the probability exemplars give a different view of what students can be expected to understand about probability compared with the curriculum document or the NCEA level 1 achievement standards.
Answers to Activity
Game
A game for investigating probability
Activity
1. a. 1 is impossible. 2 and 12 are very hard to get.
b. 6 and 8 are quite easy. 7 is easiest of all.
2.
The probability of obtaining each number is:
1: 0/36; 2: 1/36; 3: 2/36; 4: 3/36; 5: 4/36; 6: 5/36; 7: 6/36;
8: 5/36; 9: 4/36; 10: 3/36; 11: 2/36; 12: 1/36
3. The dice should have the numbers 0, 1, 2, 3, 4, 5 and 1, 1, 1, 7, 7, 7.