This is a level 3 statistics activity from the Figure It Out series.
A PDF of the student activity is included.
Click on the image to enlarge it. Click again to close. Download PDF (1067 KB)
show data on a graph
make a conclusion from the data
This diagram shows the areas of Statistics involved in this activity.
The bottom half of the diagram represents the 5 stages of the PPDAC (Problem, Plan, Data, Analysis, Conclusion) statistics investigation cycle.
Statistical Ideas
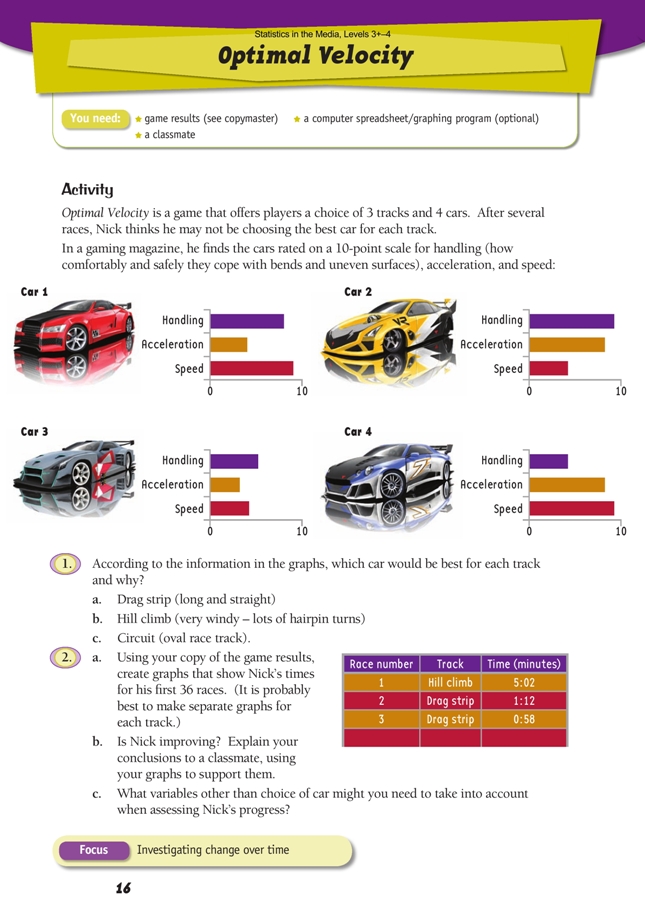
Optimal Velocity involves the following statistical ideas: interpreting bar graphs, using graphs such as scatter plots for analysis, and using statistics to make decisions.
A computer spreadsheet/graphing program (optional)
FIO, Levels 3+ -4, Statistics in the Media, Optimal Velocity, page 16
A classmate
Discuss with your students popular computer games that they play. Statistics for the games they play may be available online. The students may find it interesting to analyse these after they have looked at the comparatively simple context in the students’ book.
For question 1, you may need to discuss with the students what is meant by handling and what effects good handling, acceleration, or speed have on the ability to race well.
For question 2, it is diffi cult to analyse the race times if they are considered just as a string of numbers. Encourage the students to use graphs to help paint a picture. Scatter plots like those in the Answers work well for this activity. The students will need to separate the times for the three different track types to see any pattern, either with separate graphs (as in the Answers) or by using different colours or symbols.
Extension
Students who have access to and/or interest in a game that gives times or points for performance may be interested in investigating how environmental distractions affect their performance.
You could challenge the students to design an experiment or a “fair test”. Suggest that they limit themselves to two variables (for example, silence or loud music while playing the game). They will also need to repeat the experiment under the same conditions a number of times for results to be more reliable.
The students may like to look at some statistics of real cars and discuss what features are important in a decision to buy a car, for example: cost, comfort, reliability, safety, and appearance. A good starting point for this is the free advice available on www.consumer.org.nz (look under Cars, Car buying guide). The students could also discuss which features are important for a family car as opposed to a racing car.
Answers to Activity
Activity One
1. a. Drag strip: car 4 because it accelerates fast and has top equal speed
b. Hill climb: car 2 because it handles well and accelerates well
c. Circuit: car 1 because it handles well and has top equal speed
2. a. Graphs will vary. For example (with times converted to seconds):
b. Your graphs should show that Nick’s times improve for the fi rst few races on each track and then remain relatively constant. The times stay low after 10 races, which suggests that he had reached a plateau in terms of his ability to operate the cars.
c. Variables that you might take into account could include time of day, whether anyone is watching Nick, or the noise level around him. These could all affect his progress.
Key Competencies
Optimal Velocity can be used to develop these key competencies:
• thinking: interpreting, exploring, and using patterns and relationships in data, making
decisions
• using language, symbols, and texts: interpreting visual representations such as graphs.