This is a level 5 number activity from the Figure It Out series. It relates to Stage 8 of the Number Framework.
A PDF of the student activity is included.
Click on the image to enlarge it. Click again to close. Download PDF (599 KB)
explore how scale factors for length affects area
Number Framework Links
Use this activity to:
• help students consolidate and apply their knowledge of fractions at stage 8
• develop confidence in students who are beginning to use advanced proportional strategies (stage 8).
A calculator
Access to a photocopier
FIO, Level 3-4+, Proportional Reasoning, Book One, Smart Sizes, page 21
Internet access (optional)
This real-life context offers scope for a rich mathematical investigation of ratios. As long as the focus is on area, students can get a long way by doubling or halving. When the focus is on length, they face a greater challenge but will discover some surprising patterns.
Introduce the activity by explaining that the codes A3 and A4 are part of the ISO (International Organization for Standardization) system, set up to encourage countries to use the same units of measurement.
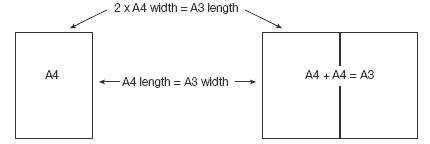
When doing question 1, students should work with actual sheets of paper and discover these relationships for themselves:
As a next step, they can make a chart that compares the area of different-sized sheets, using A4 paper as the unit:
Get your students to continue the pattern for sizes smaller than A4:
They should note that as the numerical code for the sheet size gets larger, the area of the sheet gets smaller.
As part of question 1b, get the students to measure the length and width of each size of paper in millimetres. They can then use a calculator to compare the length with the width and express this as a ratio or as a scale factor (multiplier). In the case of an A4 sheet, length:width = 297:210.
297/210 = 1.414 (3 d.p.). The scale factor is 1.414, and the ratio is 1.414 : 1. If students check the length:width ratio for different sheet sizes, they will find that it remains the same, regardless of size.
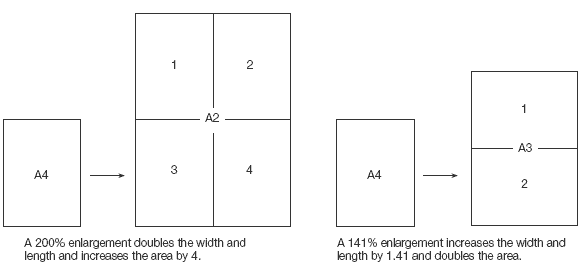
The challenge for students in question 2 is to explain why a copier uses a scale factor or ratio of 141% to enlarge an A4 page to A3 size instead of the 200% that they might have expected, and why it uses a ratio of 71% instead of 50% for an A3 to A4 reduction. The reason is that the ratio used by the copier refers to length, not area:
Students could check the above by drawing a rectangle in a computer drawing program and then using the Enlarge function to increase it by a ratio of (i) 200% and (ii) 141%. They could then check the effect of the ratios 50% and 71%.
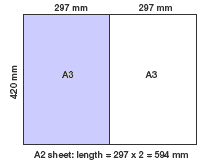
For questions 3–4, get the students to make a table of the lengths and widths of paper sizes, looking for connections that will help them to complete the table to A0 size:
They should see that the length of one becomes the width of the next size up and the width of one doubles to become the length of the next size up. When they check the official dimensions of A1 and A0, they will find that their lengths are out by 1 or 2 mm (due to rounding errors), but this is within the tolerance set down by the ISO standard.
In question 4, students can use a calculator to work out the area of an A0 sheet. Have them express their answer in square metres (either by changing the lengths from millimetres to metres before calculating the area or by dividing the area in square millimetres by 1 000 000 to convert it to square metres.)
The A0 sheet is the unit on which all other sizes are based. Students can easily check that it has an area of 1 m2 and find out much more about the ISO system of paper sizes (including series B and C), using the Internet. A search on “ISO paper sizes” will bring up a number of useful sites.
When the students explore folds in question 5, they should make a chart that shows the number of sheets they get for each number of folds. You could show them how to record this information using exponents. If they do this, they will see that the code for the paper size contains within it the number of folds. (If you fold an A0 sheet 5 times, the resulting sheets will be A5 size.)
By reversing and extending the chart they made for questions 3–4, your students should be able to continue the pattern and answer question 6:
As an extension to this activity, interested students could explore www.iso.org. This is the website of the International Organization for Standardization. Much of its content is expressed in language that is accessible to students.
Answers to Activity
1. a. The A3 sheet has twice the area of the A4 sheet.
b. The length of the A4 sheet is the same as the width of the A3 sheet.
The length of the A3 sheet is twice the width of the A4 sheet and about 1.4 times the
length of the A4 sheet. (420/297 = 1.414)
2. a. 141%
b. 71%
c. If you enter 200%, you double the length and the width, which multiplies the area by 4. 50% halves the length and width and shrinks the picture to 1/2 x 1/2 = 1/4 of the original size.
3. 594 x 420 mm:
4. 1 m2. (This tidy measure is not an accident! Those who set up the system chose it for convenience.)
5. a. 5 times
b. 32 sheets. (2 x 2 x 2 x 2 x 2 = 25 = 32)
6. a. 37 x 26 mm
b. The answer depends on the stamp, but it is most likely to be A9, A10, or A11.


