Purpose
The purpose of this activity is to support students in creating dot plots, both manually and digitally, and making sense of the displays at the level of individual data points.
Achievement Objectives
S4-1: Plan and conduct investigations using the statistical enquiry cycle: determining appropriate variables and data collection methods; gathering, sorting, and displaying multivariate category, measurement, and time-series data to detect patterns, variations, relationships, and trends; comparing distributions visually; communicating findings, using appropriate displays.
Required Resource Materials
- Squared paper
- Rulers or tape measures
- Post it notes
- Materials for manually creating dot plots (e.g. rulers, pencils, grid paper)
- Access to CODAP or a similar online statistical tool.
Activity
- Share this problem with your students:
How long and wide are the feet of people your age?
Who might want to know the length of feet?
How could we find out and display this data?
If possible, make links to relevant learning from other curriculum areas (e.g. technology -shoe creation), and students' interests (e.g. the size of Olympic runners' feet). Let students discuss how they might find an answer to the problem.
They should suggest some important ideas about measurement, such as:- Consistency about how the length and width are measured, from where to where?
- Tools that will be used, rulers, tape measures or a template (foot sizing chart – see online)
- Using appropriate units to measure a accurately, in this case centimetres or millimetres.
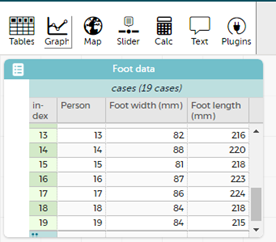
- After deciding on a standardised method for measuring length and width to millimetres, let students gather the data in pairs. They should record the measurements on a post-it note or square of paper folded in half (i.e. on a data card). If there are few students ask them to gather data from a whole class. Consider strategically pairing students to encourage tuakana-teina and productive learning conversations.
- Instruct the students to cut each of their data squares in half. Organise the halves into width and length piles.
Let’s look at width of our feet first.
Spread out the half-squares.
How can we organise these data?
Look for students to suggest organising the data by grouping the half-squares. This might include ordering the data by number size, grouping same measures together, and creating ranges of measures. Let students explore the methods suggested.
- Once the data are ordered use the half-squares to manually create a dot plot. Students should follow your steps to create their own display of the same data. You might introduce relevant te reo Māori kupu throughout the rest of this activity, such as kauwhata ira (dot plot) and ine whānui (range).
- I need a number line to show all these numbers (measurements). I do not need to include numbers like zero that cannot be here. Draw an empty number line.
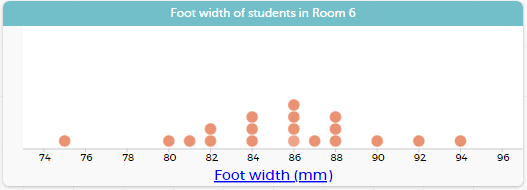
What is my lowest measurement? What is my highest? (For example, 76 mm is narrowest, 94 mm is widest). Use these figures to decide on the minimum and maximum values to be located on opposite ends of your number line, before deciding on the intervals to be used on the graph's scale.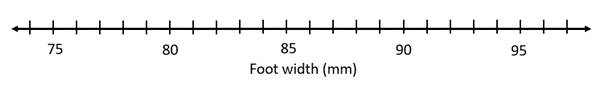
- Allocate a few data points to the graph, by choosing half-squares ‘randomly’.
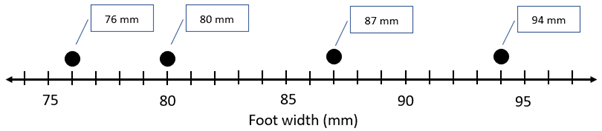
- Ask the remaining students to add their data to the graph. Model how to display many equal foot widths as a vertical stack of dots.
- I need a number line to show all these numbers (measurements). I do not need to include numbers like zero that cannot be here. Draw an empty number line.
- Use an online graphing tool such as CODAP to digitally display the same data. This benefits students by highlighting the functionality of digital tools for sorting and displaying the data.
- First, make a spreadsheet to record the data then save the file as a CSV file.
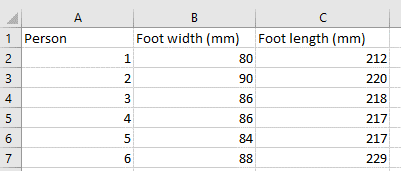
- Second, upload the CSV file. A table of data will appear. Click "Graph".
- Drag and drop the variable labels (e.g. person) to create the display. You can experiment with the different displays that can be created from dropping variable labels into different areas of the graph space (e.g. onto each axis, into the graphed space).
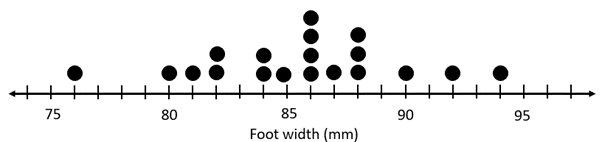
- Discuss how the display answers the question.
How wide are the feet of people your age?
Students might realise that this display cannot tell us about all people of their age, since the dot plot shows a small sample.
How wide are our feet?
Focus on range with statements like, “Our feet are between 75 and 94 millimetres in width.”
Focus on centre with statements like, “The middle width is about 86 millimetres.”
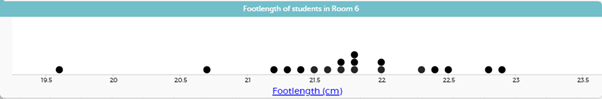
- Use the length data from the half-squares to let students create their own dot plot manually. Discuss the displays, focusing on spread, possible shape, and centre. CODAP could be used to create further digital data displays.
Next steps
- Create dot plots where the data values involve 3-digit whole numbers that have spread over several centuries or decimals to 1 or 2 decimal places. For example, if feet were measured in centimetres, not millimetres, the dot plot data might be spread between 19.5 cm and 22.5 cm.
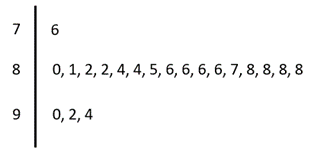
- Explore other ways to present numeric data, such as stem and leaf plots.
Add to plan
Level Four