Purpose
The purpose of this activity is to support students in using percentages to compare two amounts in both directions, smaller to larger and larger to smaller.
Achievement Objectives
NA4-3: Find fractions, decimals, and percentages of amounts expressed as whole numbers, simple fractions, and decimals.
Required Resource Materials
- Connecting cubes
- Paper and pens
- Calculators
Activity
- Pose this problem, or another that is adapted to a more specific context that is more relevant to your students' interests, cultural backgrounds, and learning from other curriculum areas.
You find two different prices for an item, $12 and $15.
What percentage is the lower price of the higher price?
What percentage is the higher price of the lower price?
What percentage statements can you make about the two amounts?
Construct a cube stack model or diagram of the problem, like this: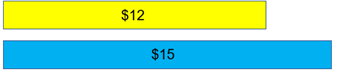
- Look for students to make the statements below, drawing on their prior knowledge (and possibly experiences of previous lessons in this intervention).
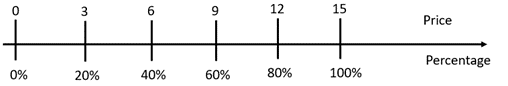
- $12 is 4/5 of $15 so it is 80% of the largest price. On a calculator 12 ÷ 15 = 0.8 = 80%.
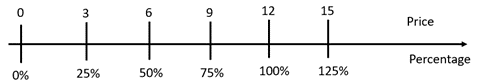
- $15 is 5/4 of $12 so it is 125% of the least price. On a calculator 15 ÷ 12 = 1.25 = 125%.
- Support students to summarise the percentage relationships between $12 and $15 using a diagram. Below, the relationship is shown using a flow chart and multiplicative expressions (12 x 1.25 or 125% = 15, 15 x 0.8 or 80% = 12).
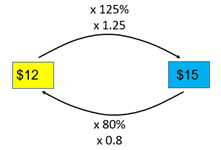
What do you notice about the multipliers?
An important observation is that the multipliers 1.25 and 0.8 may seem unrelated as decimals. However, when they are converted to the fractions 5/4 and 4.5, their relationship is more obvious.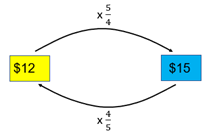
- Pose a similar problem using easy amounts to see if students can work out the relationships independently. Allow the use of supports such as empty number lines and calculators.
You find two different prices for an item, $25 and $15. What percentage is the lower price of the higher price? What percentage is the higher price of the lower price? What percentage statements can you make about the two amounts?
- In this case $5 divisions are useful on the empty number line as both $25 and $15 are divisible by five. Start with the larger amount, $25 as the unit of comparison, the whole.
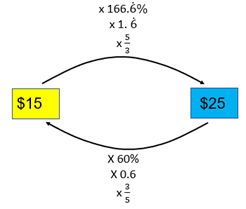
What fraction is $15 of $25? (3/5)
What percentage is $15 of $25? (3/5 = 60%)
What calculation can we perform to check our prediction? (15 ÷ 25 = 0.6 = 60%)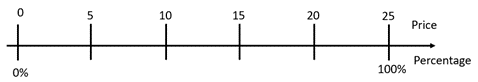
- Progress to the smaller amount $15 as the unit of comparison, the whole.
What fraction is $25 or $15? (5/3)
What percentage is $25 of $15? (5/3 = 1 2/3 = 166.6%)
What calculation can we perform to check out prediction? (25 ÷ 15 = 1.6 = 166.6%).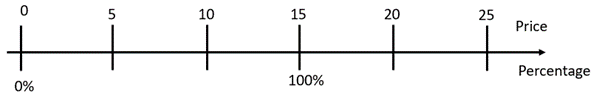
- Ask students to summarise the relationships between $15 and $25 in diagrams. It is shown using a flow chart in the image below.
- Pose more difficult scenarios as students develop greater independence. Support students to create double number line and/or flow chart models to solve the problems. Adapt the problems as necessary and consider grouping students to encourage tuakana-teina. You might introduce relevant te reo Māori kupu such as whakahekenga ōrau (percentage discount) and rārangi tau matarua (double number line).
- You find two different prices for an item, $20 and $30.
What percentage is the lower price of the higher price?
What percentage is the higher price of the lower price?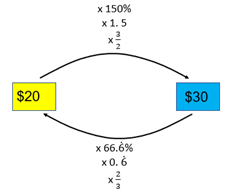
- You find two different prices for an item, $16 and $40.
What percentage is the lower price of the higher price?
What percentage is the higher price of the lower price?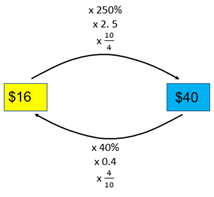
- You find two different prices for an item, $50 and $80.
What percentage is the lower price of the higher price?
What percentage is the higher price of the lower price?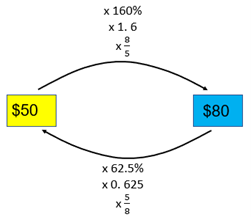
- You find two different prices for an item, $20 and $30.
Next steps
- Introduce problems in which both the relationships between the amounts are untidy. Realistic situations of percentage comparison often involve numbers that are messy.
Look to see if students can generalise an algorithm that works for any percentage comparison problem, and use estimation strategies to check if an answer is reasonable. For example:
A pair of jandals in Brazil costs $22. The same jandals in Mexico cost $49. What percentage relationships can you find between the two amounts?
Rounding 22 to 20 and 49 to 50 gives an estimate of percentages. 20/50 = 2/5 = 40% and 50/20 = 5/2 = 250% are reasonable estimates. It is important to establish what each percentage refers to, such as 40% is the approximate percentage that $22 is of $49.
Using a calculator, 22 ÷ 49 = 0.449 (rounded) which is 44.9% and 49 ÷ 22 = 2.23 (rounded) which is 223%. Both actual answers are close to the estimated percentages.
Add to plan
Level Four