Lesson One: Exploring bullying statistics in New Zealand
In this unit students explore some statistics about bullying in New Zealand schools.
TIMSS 2014/15 and PISA 2015
- There are several online articles about bullying available if you want students to search for information. However, a very brief summary is provided in PowerPoint 1. Show the first three slides of the PowerPoint.
Stop after slide three and discuss these questions with your students:- Do the findings surprise you?
- Do the findings match your experience at school?
- Some students might perceive bullying to be only physical violence. Broaden the idea of bullying by asking:
What kinds of behaviours (things people do) might be bullying? - Make a list of bullying behaviours then look at Slide 4. Copymaster 1 is a bigger copy of the graph for students to use.
- Ask students to look at the graph and interrogate it. Get them to discuss the graph, in small groups, and record their thinking about how the data about bullying may have been gathered.
How did the people who created this graph gather their data? - Encourage the students to research online, a search for "TIMSS 2014/15" should lead to the Education Counts report. The Ministry of Education report He Whakaaro: What do we know about bullying behaviours in New Zealand? (Mhuru, 2021) contains TIMSS key facts which are useful to interrogate the data provided in the graph. Some interrogative questions to use to support student thinking are:
- Who was surveyed?
- Who did the surveying?
- When was the questionnaire completed?
- Who is the graph of? How do we know?
- What data is the graph showing?
- Which survey question was used to provide the data in the graph?
- Hint: look at year 5 student and year 9 student survey questionnaire for TIMSS
- For 15-year-olds use the 2018 PISA report (search for "PISA 2018 New Zealand students' wellbeing" to find the PDF document)
- Bullying information from PISA is in the wellbeing report from page 20 on.
- Rove around to see what students are thinking. Encourage them to be specific. In particular:
- Do they discuss asking a group (sample) of people?
- Who do they select? (School aged children at ages 9, 13 and 15 years)
- How many people do they select? (Sample size)
- What do they ask the people they select? (Specific response examples)
- Gather the class and discuss the points above. The sample sizes in TIMSS and PISA are very large, e.g. over 8,000 students in TIMSS 2014/15. You might ask what a practical sample size might be for a small study. Students might highlight that asking a small number of people may not give reliable results. Why not? (variability)
Why couldn’t we ask a very large number of people? (Only so many students in our school, too much time, hard to process all the data) - Once you have interrogated the graph and understand what data was collected, from who, and how it was collected, start to discuss the findings.
- Ask your students what they notice about the graph. Use the starter “I notice…” on the board and get students to work in small groups to notice everything they can. This may also require them to go back to the data source to see more about where the data came from.
Look for the following capabilities in your students:- Do they recognise that the triple bars refer to data from different age groups?
- Do they notice that the percentages of students reporting bullying are higher for younger students than older students? [Why might that be? – see page 28 of the PISA report]
- Do they notice that the length of specific bars provides a percentage?
- Can they read off specific percentages?
- Do they know what percentage means? (A rate of x in every hundred students)
- Can they classify the bullying behaviours? [e.g. physical, verbal, emotional, etc.]
- Do they notice that posting embarrassing things about me online is only for year 9 students, why? [year 9 questionnaire was the only one that asked about that]
- Why are there no 15-year olds in the “somebody shared embarrassing information about me” or “I was made to do things I didn’t want to do” categories? [these were not in the PISA questionnaire]
Extra bullying data to explore if needed for the lesson
If there is time in the lesson, the 2015 CensusAtSchool questionnaire had four questions on bullying. Data from these questions were shared with the media in the form of press releases. More recent questionnaires have not included questions on bullying. However, it could be worth looking at CensusAtSchool questionnaires for other data to use with your class.
On 12 June 2015 CensusAtSchool made a press release with the heading: Verbal abuse the biggest bullying problem at school: Students.
Subsequently Radio New Zealand, Maori Television, NZ Herald, and Stuff (twice) published their own articles based on the CensusAtSchool press release. See links to all articles here.
Students can read the original press release and then in groups pick one of the other press articles and compare the press articles with the original press release. Ask the students what they think they should compare. E.g. is the data used in the article the same as the press release, what additional reporting has been included, is it relevant to the topic?
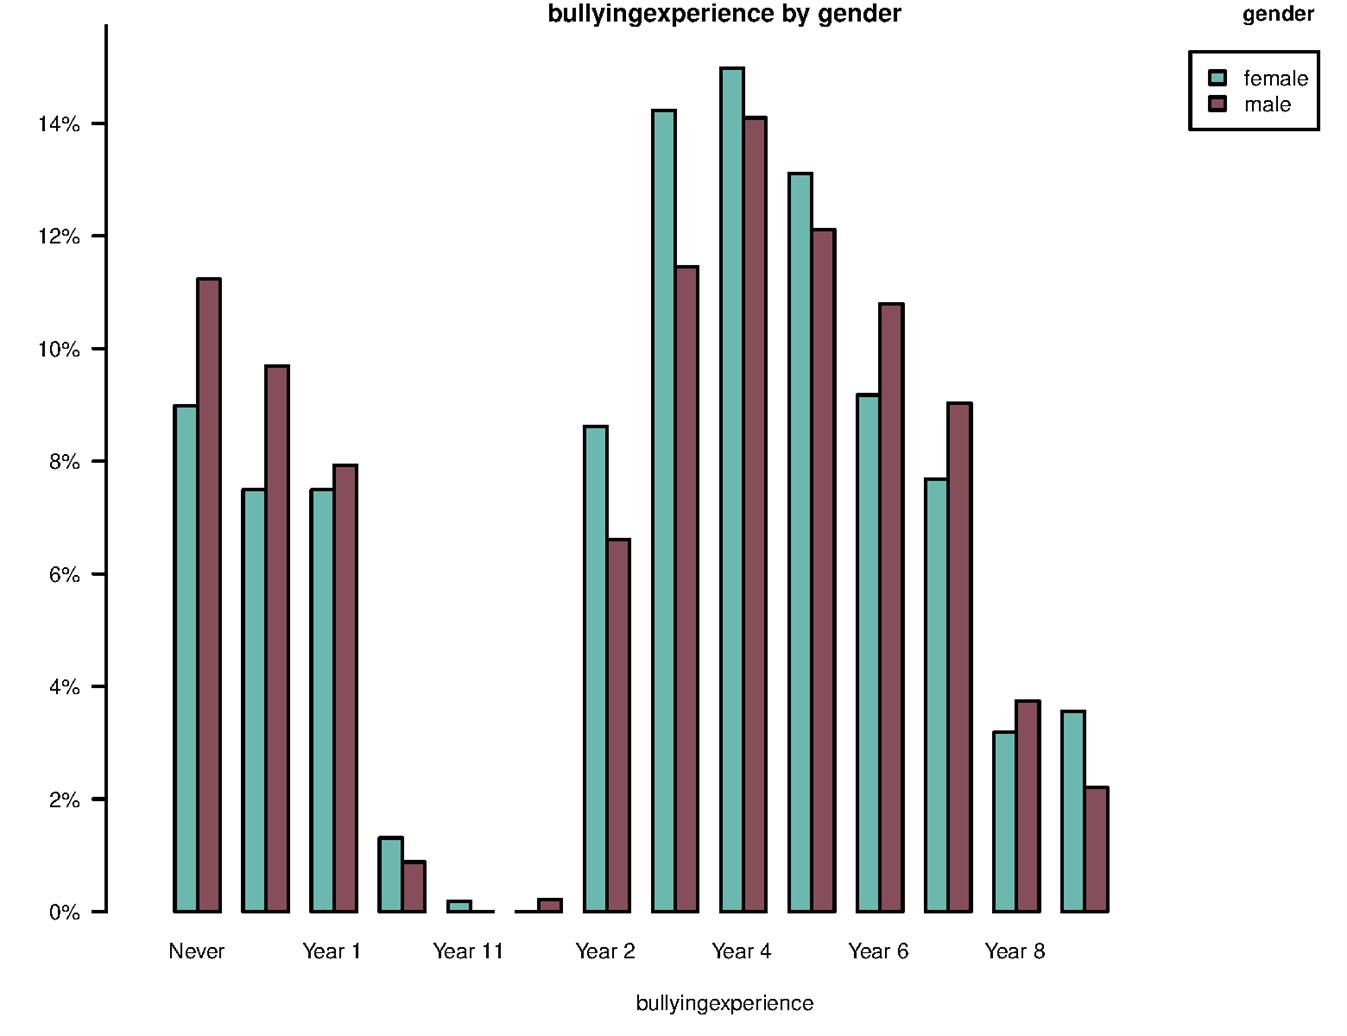
Copymaster 2 has nine graphs made from a sample of 1000 students from the CensusAtSchool 2015 database. See if these graphs support the evidence in the original press release.
You can make your own graphs by downloading a sample from the CensusAtSchool data viewer. Agree to the conditions of use; in the plan section select the CensusAtSchool NZ 2015 database, for the total sample size put 1000. Then select get data. This results in the Analysis section coming up, and therefore the option for graphing. Select the variable(s) to investigate, then select "do analysis". Students can do additional analyses by repeating the process - select a variable, then select "do analysis". The graphs stack up on the screen.
Introducing the PROBLEM
Today we have explored existing data on bullying in New Zealand in preparation to undertake our own statistical investigations on bullying. This will be our topic to investigate. Over the next few lessons we will explore developing a questionnaire, collecting and analysing data and reporting our findings.
Lesson Two: Understanding survey questions
In this second lesson we will explore existing survey questions on bullying to help us to see the structure of survey questions and to consider good ethical practices for collecting data, especially for potentially sensitive topics. We will look at the different types of survey questions that might be asked.
- Show the students slides five to seven of PowerPoint 1. The survey questions shown are taken from publicly available surveys about bullying. For each survey question, ask students about what is found out from the survey question.
Why might the investigators want that information?
The main purpose is to extend students’ ideas about what might be asked about bullying, from establishing its occurrence (what, when and where), to finding out actions that students take, and ideas about how the situation might be improved, if it needs to be. - Copymaster 3 has the three slides on one page for students to answer. Hand out the sheet and ask students to think about their possible responses to the survey questions. They are not to answer the survey questions, just think about their possible responses. Once this is done, ask the students to discuss in their groups if any of the survey questions would be hard to answer, by themselves or by others, and why, and whether there are any issues with the wording of any of the survey questions. Groups to make notes to report back to the class.
Note for teachers: Students are not asked to complete this questionnaire on paper, in class, for ethical reasons. Two key ethical practices that potentially would be violated are:- minimising the risk of harm to participants
- respecting and protecting participants’ privacy and confidentiality
- Feedback may include:
- The ethnicity survey question requires a student to opt for one ethnicity when some may identify themselves with two or more ethnicities, e.g. The child of a Thai mother and Samoan father. This survey question assumes students will identify with only one ethnic group “the most”. This is not a good assumption.
- The open response survey question, about why no action was taken, might imply blame. That can lead to students not answering honestly. When people respond to survey questions either by providing incorrect information or by answering untruthfully this is called a response bias and is an example of a non-sampling error.
- Students may indicate that one or more of the survey questions made them feel uncomfortable or that they did not want to answer them. They probably will not want to explain why, but point out to them that when they get to develop their own survey questions they need to think about this when they write their own survey questions – they should ask themselves if others would feel comfortable answering the survey question.
CensusAtSchool 2015
The 2015 questionnaire for CensusAtSchool had four questions on bullying.
In preparation for completing the online questionnaire teachers were provided with a PowerPoint to support their students with the sensitive topic. Show your students the PowerPoint 2 presentation, including the introduction to CensusAtSchool.
The first three slides set up the purpose for CensusAtSchool and talk about participating in the census. Understanding the purpose of a survey is important for those who choose to participate.
The next three slides discuss the bullying survey questions. The slides allow the teacher to introduce the topic of bullying, definitions of bullying, the idea of getting consistent responses for the survey and where to go for support.
Share the four questions on bullying from the 2015 CensusAtSchool survey (Copymaster 4). Ask the students to think about how they would respond to these survey questions and then to discuss how they would feel about answering these survey questions? How are these survey questions about bullying different to the ones we looked at earlier? How are they similar?
These are all ideas that can inform the students developing their own survey questions about bullying.
Collecting demographic data
In the next lesson students will develop survey questions about bullying. One of the areas to think about is what demographic data should be collected.
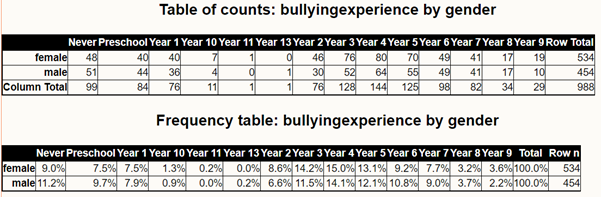
Demographic data includes data about ethnicity, gender, location, education, class level, position in family etc. Demographic data is often used to split the data into groups to compare. For example, two of the graphs (Graphs 6 and 9) from the CensusAtSchool survey (Copymaster 2) on bullying show the data compared by gender. Graph 6 is also shown below.
What personal information should be found out about the students?
Students might suggest the usual demographic variables such as age, class level, gender, and ethnicity. They may suggest other variables of interest, such as position in the family, e.g. first born, middle child, youngest child.
Ask the students if we should ask for people’s names and why or why not? Hopefully, they will say no and make links to confidentiality and validity (i.e. people might not answer honestly if they can be identified).
It is good to also ask about other demographic data that they have suggested.
Which of these might also identify people too easily, even if we do not have people's names?
Suggestions could include ethnicity, especially if there is only one child of a certain ethnic group in a class, and even ethnicity with gender – a single girl or boy of one ethnicity.
Lesson Three: PLANNING to collect data to answer investigative question(s)
Remind students that the topic we are investigating is bullying. We will develop survey questions to explore the topic in this lesson. To investigate the topic we need to think about the areas of bullying that we could target.
Share with the students that bullying surveys usually include sections of survey questions. The sections are based on what the investigators want to find out. Common themes are:
- Types of bullying and frequency (What and how often?)
- Location and timing (Where and when?)
- Responses to bullying by students (How do they react?)
- Knowledge of help to counter bullying (Who/Where to go to? What can you do to help?)
- Effects of bullying on the well-being of victims (What are the effects?)
- Rationale for bullying (Why do students think bullies bully?)
- Improvements (How can the school improve?)
Reflect on previous survey questions from lesson two and identify which of these themes the survey questions are about.
Developing survey questions on bullying
Ask your students to choose four themes and write one or two survey questions for each one. Suggest limited response survey questions rather than open survey questions to keep data handling manageable. Handling of open response data is dealt with later. You may want to discuss PowerPoint 3 which shows the three most common types of closed survey questions. Focus on the advantages and disadvantages of closed survey questions.
- Advantages: Short time for respondents to complete, data is easy to code and interpret, allows use of numbers (quantitative methods).
- Disadvantages: Respondents are forced to select an answer they do not totally agree with, reasons why they answer as they do are not available.
Let your students work in teams of three to develop survey questions. Preferably they should do so digitally so the survey questions can be edited, and combined with others, to form the final survey. Provide feedback as you go around.
Will the survey questions provide important data?
Are the survey questions simply, and briefly written?
Are the words and phrases unambiguous?
Does each survey question include only one idea, not multiple ideas?
Are the survey questions neutral, avoid leading statements, and offer a full range of options for students to choose?
About ethics:
Is the survey question one that students at our school would be happy to answer?
Are the survey questions sensitive to different cultural and religious perspectives?
Before sharing survey questions with the class, ask the students to trial each survey question with at least two other students who are not in their team. The survey questions should be rewritten if needed.
Share a few of the survey questions with the whole class. Focus on the above criteria for good survey questions. Organise the survey questions under the seven themes above.
Defining our investigative questions
Our next task is to develop a questionnaire to answer our investigative questions. First though we need to define our investigative questions we want to answer.
Reflecting on all the exploration and development work we have done to date, pose 2-3 investigative questions that we can answer through collecting data about bullying. The themes we have looked at previously will help you with this. [For more on posing investigative questions see Travel to school]
Creating a questionnaire to answer our investigative questions
Display all the survey questions that were developed under the theme headings. Students develop a bullying questionnaire in teams of three. Set the restriction that the survey must:
- Ask three demographic survey questions (Name is not included – Why?)
- Address four themes
- Ask two or three survey questions per theme
- Include survey questions that will help to answer their investigative questions
Have the class pool of survey questions stored digitally on an accessible drive so that students can cut and paste to form their questionnaires. It is a good idea to introduce checking once the questionnaires are drafted. Each group can check to see that the questionnaire of another group is sound.
Once the questionnaires are checked and completed these should be entered into an online survey tool, such as Google Forms or SurveyMonkey. Be aware that some platforms often incur a charge. Two advantages of digital platforms are that the data is entered by respondents, and the data is downloadable as a spreadsheet.
Prepare for the surveys to be completed by other classes. Think about the ethics of data collection as a class and which of these are important in the invitation we send and the information we give to the classes that will complete our surveys for us. The main ideas to discuss here are:
- obtaining informed and voluntary consent from participants
- respecting participant’s right to withdraw at any time without giving a reason
- respecting and protecting participants’ privacy and confidentiality
- avoiding any unnecessary deception to participants
These ideas can also inform an introduction to the survey which outlines things such as the survey is anonymous, no names are collected, and no identifying information is asked.
Lesson Four: Collecting DATA and ANALYSING data
- Get each group to gather data from another class in the school using their survey. This will probably involve going to the class, a brief introduction to the purpose of the survey and then being available during the survey to answer any questions.
- Students could also survey a class from another location if you have a reciprocal arrangement. The advantage of reciprocal arrangements is that your students will experience first-hand being a respondent to a survey. That will make them sensitive to the importance of clear survey question construction, and the time taken to respond.
- Once the students from other classes have completed the survey, students can process their data. While processing can be done manually there are advantages to using statistical software e.g. CODAP or similar, in terms of display and calculating statistics. For more on using CODAP see Travel to School and Planning for a statistical investigation Level 3.
Lesson Five: CONCLUSION – answering the investigative question and reporting our findings
In the final reflection part of the unit students are required to report their findings about bullying. They are also encouraged to think about their process of investigation and what they have learned from it.
- Provide time for your students to construct a report that shows the results of the investigation. Copymaster 5 could be provided electronically as a .docx or copied into a google doc so that students can write into it, and import data displays they have created.
- Invite different groups to share their findings. Accept the fact that a non-finding, such as little bullying is reported, is a legitimate result. Where bullying is reported, look for students to connect the variables as well as reporting on the results of individual questions. For example, there might be a connection between type of bullying and location or time that the bullying occurs, e.g. social bullying occurs most in the playground at play and lunch times. Also encourage the students to make recommendations about how the school can apply and use anti-bullying strategies, such as educating students about how to respond to bullying, and being aware of the most vulnerable students.
- The class might compile a report for the principal or Board of Trustees detailing the findings and recommendations. Any report should respect the confidentiality of the students who responded so that details about individuals, and classes, remain confidential. Links could also be made to persuasive and informative purposes for writing.
- If time permits you might like to investigate how to deal with data from open response questions. PowerPoint 4 has an example of an open response question, and a fictitious set of examples of students’ answers. Coding of open responses generally proceeds in two ways:
- A set of categories is established beforehand based on expectations, preferably informed from reading.
- Builds categories as they become needed.
- Ask your students to read the comments on Slide Two.
Are there things in common about the comments? How could we group them? - Students might suggest sensible ways to classify the comments. Alternatively, click the mouse so that the comments appear in different colours.
How have the comments been grouped? - Challenge students to describe the categories. They might suggest:
- Yellow: Student’s behaviour encourages bullying
- Green: Racial discrimination
- Blue: Physical disability
- Pink: Family circumstances
- Purple: Learning disability
- If any groups have collected open response data that might be used as an example where students can practise coding data.

All about angles
This unit supports students to understand angles as a turn relationship between two rays, and to apply their understanding in sport and design settings.
In this unit the students will discover how to measure angles. All measurement is the assigning of quantity to an attribute (a feature or characteristic). An angle is created by rotation or turn. Most angles that students encounter are presented in static form. For example, angles in a room, or in household furniture, are already constructed. An angle in those situations is the intersection of two or more planes (flat surfaces). Two dimensional diagrams of angles are also presented in static form, illustrating that two rays intersect at a common point.
However, it is the relationship between the connecting rays that constitutes the angle. That relationship is the turning of one ray onto the other, at about the point where they meet.
We owe our system of measuring angles to the ancient Babylonian civilisations (c. 3000-539 BC). The Babylonian number system was based on 60, and the measure of 360° as a full turn was based on a calendar of 360 days. Therefore, the creation of a measure of angle was a result of wanting to quantify the dynamic passage of time. 360 is a good base as it is easily partitioned into many fractions, e.g. ¼ of 360° equals 90°.
The learning opportunities in this unit can be differentiated to cater for the current achievement levels and learning preferences of your students by providing or removing support to students, and by varying the task requirements. Ways to support students include:
Adapt the contexts for working with angles if needed, to meet the needs, interests, and cultural backgrounds of your students. Sport is a motivating context for many students, and logos are a familiar context. However, students might be more motivated by the context of physical journeys, such as hiking or yachting, especially in America’s Cup time. Angles in culturally significant buildings or maps of the local area might be used. Navigation systems used by Polynesian mariners is likely to inspire some students.
Te reo Māori vocabulary terms such as koki (angle), koki hāngai (right angle), hihi (ray), hurihanga (rotation), and ine-koki (protractor) could be introduced in this unit and used throughout other mathematical learning.
Session One
In this exploration students attend to situations where angles are present. In doing so, they recognise that these situations can be dynamic, e.g.an ice skater turning, or static, e.g. a playground slide.
In each of these pictures there is an angle. Tell me where you can see angles. Have a korero with a partner and share your ideas.
Where is the angle in this picture?
Is the angle staying the same, getting smaller, or getting bigger?
What is causing the angle to get bigger?
Students usually agree that the angle is increasing in size though they may be attending to area, and not to rotation. It is also important that students realise that an angle can be greater than a right angle. You might mention the right angle when the rotation reaches 90⁰.
What are the important features of an angle?
Students should mention the intersection (important), the rays (rather than lines), and the turn, which is the relationship between the two rays.
Which pair of scissors is the most open?
Some students might suggest measuring the angles with a protractor. The animation shows how to do that (use mouse clicks to navigate).
You are now going to learn a bit about how people learned to measure angles based on the Babylonian method from many years ago.
Session Two
If the commentator said that a player scored from an acute angle, what would that mean?
Are there kicking positions that are harder to score from than others? Why?
Let’s imagine the kick is only 20 metres from goal.
Which position gives you the best chance of kicking the goal? Why?
As the kicker moves further away from the central point the angle gets smaller, making the shot more difficult. In real games, a kicker taking a kick from a non-central position, moves further back to increase their angle.
Create a table like this:
What do you notice about the success rate as the angle changes?
Naturally the success rate declines as the angle declines. Likewise, success rate increases as angle increases.
Session Three
In this lesson students play two games related to angles, snooker and golf. Look up short videos of both sports online, and briefly discuss how angles are involved in each game.
Students need to combine their estimates of a bearing and distance to play each shot. Slide Seven shows an example of a hole being played. Provide the students with Copymaster 5, a protractor and ruler. Let them play a round of golf!
Session Four
In this final lesson students apply their knowledge of angles to create a logo with rotational symmetry.
Family and whānau,
This week we have been exploring angles. We found that an angle is a turn relationship between two rays. Then we investigated the best place for a goal kicker to shoot from, played games of pool and golf, and created our own logo. Ask us to tell you all about how angles are involved in these activities.
You can count on squares!
This unit requires students to form generalisations about the areas of triangles and quadrilaterals. Through exploring the geometry of three and four-sided polygons, students look for relationships that can be expressed algebraically. At this level it is sufficient for the students to express these formulae in words rather than with symbols.
In this unit the students will discover how to find the area of some simple polygons by linking two central areas of mathematics – algebra and geometry. In finding rules, students are encouraged to use their spatial reasoning to find relationships between variables, such as length and height.
Area is the amount of flat space bounded by a closed two-dimensional figure. Squares are used as the conventional unit for measuring area because they cover the plane (flat space) with no gaps or overlaps. Standard units for area include square centimetres (cm2), square metres (m2) and square kilometres (km2). Rectangles are the easiest polygons for discovering area as the units can be arranged in rows and columns to form arrays. Methods to find the areas of other quadrilaterals, such as parallelograms and trapezia, can be found by considering ‘morphing’ of rectangles. Areas of triangles can be found by halving parallelograms.
Opportunities for formative assessment are embedded in the development of each task. The techniques used in the development of this unit allow students to focus on problem solving, reasoning, and communicating their mathematical ideas. There is a clear and purposeful intention to engage students in articulating their thinking and the thinking of others as a way of making sense of mathematical situations, techniques and generalisations.
Activities in this unit can be differentiated to cater for the current achievement levels and learning preferences of your studentsby providing or removing support, and by varying the task requirements. Ways to support students include:
This unit is mostly context-free and the only reference to a story is creating a pen with a fixed perimeter. You might choose to use contexts that are relevant to students in your class. Area is applicable to many real-life situations such as creating a vegetable patch, carpeting, or painting a room, designing a shed or a quilt (tapa cloth), or fencing paddocks or chicken runs. Give students the opportunity to apply creativity through creating their own shapes and finding the area.
Te reo Māori vocabulary terms such as horahanga (area), tapawhā rite (square), tapawhā hangai (rectangle), tapawhā whakarara (parallelogram), tapatoru (triangle), taparara (trapezium), mita pūrua (square metre), and mitarau pūrua (square centimetre) could be introduced in this unit and used throughout other mathematical learning.
Getting Started
In this first session, the students investigate rectangles on dot paper but through the context of the rectangles that two students (Jess and Hannah) have made. Allow your class to collaborate in pairs as this helps to stimulate discussion, and supports students to clarify their ideas and resolve any problems.
Jess and Hannah are trying to solve a problem. They draw these shapes. Show PowerPoint 1.
What is the problem they are trying to solve?
For example, the area of the rectangle that has eight rows of three squares can be found using 8 x 3 = 24 or 3 x 8 = 24 (length x height is the usual convention).
How many different rectangles can be made that have an area of 24 square units?
Give students copies of the square dot paper.
With the students construct a table which records the different rectangular shapes:
Rows
Columns
Area
1
36
36
2
18
3
12
4
5
6
9
12
18
36
Do you notice the point at which the rectangles are repeated?
For example, 3 x 12 is the same rectangle as 12 x 3.
What is the relationship between 6 and 36? (since 6 x 6 is the last discrete rectangle before repeating occurs).
Six is the square root of 36 (√36 = 6)
What do you think square root means?
What is the area of these rectangles? (See PowerPoint 1 – slide 4)
A mathematician might write the area rule like this:
a = l x h
What does the rule mean? What does each letter, a, l and h refer to?
A rectangle has an area of 72 square units.
It has a length that is twice its height.
Draw the rectangle.
Students might make up a rectangle area problem like that for a classmate to solve.
Exploring
This section is divided into two parts. In Session A students discover the relation between the area of a parallelogram or trapezium and the area of a rectangle. In Session B, the area of any triangle is connected to a ‘surrounding’ parallelogram.
Session A
If the distance between each dot is 1 centimetre, what would you call the square? (1 square centimetre).
How do we write one square centimetre? (1 cm2)
If the distance between each dot is 1 metre, what would you call the square? (1 square metre)
How do we write one square metre? (1 m2)
You might like to show the actual size of the one square metre using 4 one-metre rulers.
(The aim of this task is to allow students to develop techniques that will help them to analyse the mathematical situations that they will meet in the rest of the unit.)
Show by pushing the edges a little that you get a parallelogram.
What do we call shapes like this? (Parallelogram.)
What does a quadrilateral need to have to be called a parallelogram? (Two pairs of parallel opposite sides)
You may need to use the metaphor of railway tracks to illustrate the meaning of parallel.
Which is bigger, the area of the rectangle we started with or the area of the parallelograms as we pushed?
What would happen to the area if we pushed the rectangle right over?
Why would it have no area?
Why do Jess and Hannah think the heights must be the same? (As the rectangle was pushed, the height decreased, and the area decreased as well.)
Let’s start with a parallelogram. Can we turn it into a rectangle? How?
Show the first slide of PowerPoint 2. Let your students visualise how the parallelogram might be ‘cut and pasted’ to form a rectangle.
If you click on the mouse an animation will show the transformation.
Why do the two shapes have the same area? (The area of both triangles is the same)
Can you transform a rectangle into a parallelogram?
Show slide 2 and ask students to visualise cutting a triangle off the rectangle and translating it to the other end.
The length and the height are needed to find the area of a parallelogram. Therefore:
area = length x height.
An important point to note is that height is measured using a line that is at right angles to the base.
Draw three different parallelograms that have an area of 60 square units.
The parallelograms must have the same length.
Or
Draw three parallelograms with the same height that have an area of 60 square units.
Could your answers to both questions be the same? Why?
Look for students to notice that ‘tilting’ the base rectangle but keeping the height the same conserves area.
Page two of Copymaster 1 provides many trapezia. By cutting out each trapezium, then cutting along the dotted lines, students can rearrange the pieces to form a rectangle.
How are the side lengths of the original trapezium and the rectangle connected?
In general, any trapezium can be transformed into a rectangle by cutting and pasting. The length of the rectangle is the average of the two different lengths of the original trapezium. The height remains the same.
Session B
How are the areas of the triangle and rectangle related?
Your students should note that the triangle is half the area of the rectangle.
How could we write a rule for the area of a right-angled triangle?
Record the rule as words or symbols, whatever the students come up with.
Copymaster 2 provides two copies of different triangles. Ask your students to cut out the similar (same shape) triangles and put them together to make a quadrilateral.
What kind of quadrilateral is formed each time?
How is the area of the quadrilateral related to the area of the triangle?
Students should notice that a parallelogram can be formed each time. Slides 2 and 3 of PowerPoint 3 illustrate how one triangle can be joined to the other by a half turn and a translation (shift). Focus attention on the connection between the length and height of the parallelogram and the original triangle.
Reflecting
Here the students use the formulae that they have obtained earlier to solve some problems.
Problem 1
Get the students to choose one of the shapes below, draw it on dot paper and find its area. The students can choose their own dimensions for the shapes. This can be done in at least two ways. By cutting it up into rectangles and by counting squares on the dot paper.
Problem 2
This problem could be adapted to suit the context of your learners. Instead of making a vegetable garden, students may be more interested in designing a rectangular classroom or playground. Consider what your students have recently been learning about, and are interested in, and try to make links to these areas.
You have been given 36 metres of string to ‘rope off’ a rectangular area that can be made in to a vegetable garden. What is the largest rectangular garden you can make?
Justify your choice, using diagrams and or tables of information.
Dear parents and whānau,
This week we have been exploring shapes and finding the formulas for rectangles, parallelograms and right angle triangles. Your child is to find one of each of these shapes around the house or make one of each from paper and calculate the area using a ruler and the formulas. Ask them to explain what they are doing and how the formulas are connected for these 3 shapes.
How much bullying?
This unit requires students to look at the reported state of bullying in New Zealand schools and to develop and administer their own surveys about bullying. They analyse their data and create a report outlining the results of their investigation.
This unit addresses both statistical investigations and statistical literacy. Statistical literacy is about critically examining claims made by others, that are based on data that has been gathered or accessed. Critique includes verifying the identification of important variables, sampling, the method of analysing the data, unbiased display of results, and most importantly, whether the data answers the investigative question, given uncertainty.
Statistical enquiry involves investigating a topic or area of interest, that involves an aspect of “I wonder”. The PPDAC cycle is an established part of the New Zealand Curriculum and is applied in this unit.
Ethical practices
At the core of ethical practices in statistical enquiry is the need to do good and to do no harm. Key practices include:
Interrogating survey questions
A guide to good survey design is a good resource to help with checking survey questions. See section 8.6 List of pitfalls to guard against and check for.
Interrogating statements made by others about statistical investigations
Prompts include:
The learning opportunities in this unit can be differentiated by providing or removing support to students and by varying the task requirements. Ways to support students include:
The context for this unit can be adapted to suit the interests and experiences of your students. Bullying is a commonly discussed topic in the media and is of personal interest to students. However, other topics can also be engaging, such finding out people’s attitudes about climate change, availability of fireworks or daylight saving. Note that the statistical enquiry process can be applied to many topics and selecting ones that are of interest to your students should always be a priority. You might collect data to find out which topics most interest your students.
Lesson One: Exploring bullying statistics in New Zealand
In this unit students explore some statistics about bullying in New Zealand schools.
TIMSS 2014/15 and PISA 2015
Stop after slide three and discuss these questions with your students:
What kinds of behaviours (things people do) might be bullying?
How did the people who created this graph gather their data?
Why couldn’t we ask a very large number of people? (Only so many students in our school, too much time, hard to process all the data)
Look for the following capabilities in your students:
Extra bullying data to explore if needed for the lesson
If there is time in the lesson, the 2015 CensusAtSchool questionnaire had four questions on bullying. Data from these questions were shared with the media in the form of press releases. More recent questionnaires have not included questions on bullying. However, it could be worth looking at CensusAtSchool questionnaires for other data to use with your class.
On 12 June 2015 CensusAtSchool made a press release with the heading: Verbal abuse the biggest bullying problem at school: Students.
Subsequently Radio New Zealand, Maori Television, NZ Herald, and Stuff (twice) published their own articles based on the CensusAtSchool press release. See links to all articles here.
Students can read the original press release and then in groups pick one of the other press articles and compare the press articles with the original press release. Ask the students what they think they should compare. E.g. is the data used in the article the same as the press release, what additional reporting has been included, is it relevant to the topic?
Copymaster 2 has nine graphs made from a sample of 1000 students from the CensusAtSchool 2015 database. See if these graphs support the evidence in the original press release.
You can make your own graphs by downloading a sample from the CensusAtSchool data viewer. Agree to the conditions of use; in the plan section select the CensusAtSchool NZ 2015 database, for the total sample size put 1000. Then select get data. This results in the Analysis section coming up, and therefore the option for graphing. Select the variable(s) to investigate, then select "do analysis". Students can do additional analyses by repeating the process - select a variable, then select "do analysis". The graphs stack up on the screen.
Introducing the PROBLEM
Today we have explored existing data on bullying in New Zealand in preparation to undertake our own statistical investigations on bullying. This will be our topic to investigate. Over the next few lessons we will explore developing a questionnaire, collecting and analysing data and reporting our findings.
Lesson Two: Understanding survey questions
In this second lesson we will explore existing survey questions on bullying to help us to see the structure of survey questions and to consider good ethical practices for collecting data, especially for potentially sensitive topics. We will look at the different types of survey questions that might be asked.
Why might the investigators want that information?
The main purpose is to extend students’ ideas about what might be asked about bullying, from establishing its occurrence (what, when and where), to finding out actions that students take, and ideas about how the situation might be improved, if it needs to be.
Note for teachers: Students are not asked to complete this questionnaire on paper, in class, for ethical reasons. Two key ethical practices that potentially would be violated are:
CensusAtSchool 2015
The 2015 questionnaire for CensusAtSchool had four questions on bullying.
In preparation for completing the online questionnaire teachers were provided with a PowerPoint to support their students with the sensitive topic. Show your students the PowerPoint 2 presentation, including the introduction to CensusAtSchool.
The first three slides set up the purpose for CensusAtSchool and talk about participating in the census. Understanding the purpose of a survey is important for those who choose to participate.
The next three slides discuss the bullying survey questions. The slides allow the teacher to introduce the topic of bullying, definitions of bullying, the idea of getting consistent responses for the survey and where to go for support.
Share the four questions on bullying from the 2015 CensusAtSchool survey (Copymaster 4). Ask the students to think about how they would respond to these survey questions and then to discuss how they would feel about answering these survey questions? How are these survey questions about bullying different to the ones we looked at earlier? How are they similar?
These are all ideas that can inform the students developing their own survey questions about bullying.
Collecting demographic data
In the next lesson students will develop survey questions about bullying. One of the areas to think about is what demographic data should be collected.
Demographic data includes data about ethnicity, gender, location, education, class level, position in family etc. Demographic data is often used to split the data into groups to compare. For example, two of the graphs (Graphs 6 and 9) from the CensusAtSchool survey (Copymaster 2) on bullying show the data compared by gender. Graph 6 is also shown below.
What personal information should be found out about the students?
Students might suggest the usual demographic variables such as age, class level, gender, and ethnicity. They may suggest other variables of interest, such as position in the family, e.g. first born, middle child, youngest child.
Ask the students if we should ask for people’s names and why or why not? Hopefully, they will say no and make links to confidentiality and validity (i.e. people might not answer honestly if they can be identified).
It is good to also ask about other demographic data that they have suggested.
Which of these might also identify people too easily, even if we do not have people's names?
Suggestions could include ethnicity, especially if there is only one child of a certain ethnic group in a class, and even ethnicity with gender – a single girl or boy of one ethnicity.
Lesson Three: PLANNING to collect data to answer investigative question(s)
Remind students that the topic we are investigating is bullying. We will develop survey questions to explore the topic in this lesson. To investigate the topic we need to think about the areas of bullying that we could target.
Share with the students that bullying surveys usually include sections of survey questions. The sections are based on what the investigators want to find out. Common themes are:
Reflect on previous survey questions from lesson two and identify which of these themes the survey questions are about.
Developing survey questions on bullying
Ask your students to choose four themes and write one or two survey questions for each one. Suggest limited response survey questions rather than open survey questions to keep data handling manageable. Handling of open response data is dealt with later. You may want to discuss PowerPoint 3 which shows the three most common types of closed survey questions. Focus on the advantages and disadvantages of closed survey questions.
Let your students work in teams of three to develop survey questions. Preferably they should do so digitally so the survey questions can be edited, and combined with others, to form the final survey. Provide feedback as you go around.
Will the survey questions provide important data?
Are the survey questions simply, and briefly written?
Are the words and phrases unambiguous?
Does each survey question include only one idea, not multiple ideas?
Are the survey questions neutral, avoid leading statements, and offer a full range of options for students to choose?
About ethics:
Is the survey question one that students at our school would be happy to answer?
Are the survey questions sensitive to different cultural and religious perspectives?
Before sharing survey questions with the class, ask the students to trial each survey question with at least two other students who are not in their team. The survey questions should be rewritten if needed.
Share a few of the survey questions with the whole class. Focus on the above criteria for good survey questions. Organise the survey questions under the seven themes above.
Defining our investigative questions
Our next task is to develop a questionnaire to answer our investigative questions. First though we need to define our investigative questions we want to answer.
Reflecting on all the exploration and development work we have done to date, pose 2-3 investigative questions that we can answer through collecting data about bullying. The themes we have looked at previously will help you with this. [For more on posing investigative questions see Travel to school]
Creating a questionnaire to answer our investigative questions
Display all the survey questions that were developed under the theme headings. Students develop a bullying questionnaire in teams of three. Set the restriction that the survey must:
Have the class pool of survey questions stored digitally on an accessible drive so that students can cut and paste to form their questionnaires. It is a good idea to introduce checking once the questionnaires are drafted. Each group can check to see that the questionnaire of another group is sound.
Once the questionnaires are checked and completed these should be entered into an online survey tool, such as Google Forms or SurveyMonkey. Be aware that some platforms often incur a charge. Two advantages of digital platforms are that the data is entered by respondents, and the data is downloadable as a spreadsheet.
Prepare for the surveys to be completed by other classes. Think about the ethics of data collection as a class and which of these are important in the invitation we send and the information we give to the classes that will complete our surveys for us. The main ideas to discuss here are:
These ideas can also inform an introduction to the survey which outlines things such as the survey is anonymous, no names are collected, and no identifying information is asked.
Lesson Four: Collecting DATA and ANALYSING data
Lesson Five: CONCLUSION – answering the investigative question and reporting our findings
In the final reflection part of the unit students are required to report their findings about bullying. They are also encouraged to think about their process of investigation and what they have learned from it.
Are there things in common about the comments? How could we group them?
How have the comments been grouped?
Dear family and whānau,
This week we will be exploring how data can be used to inform people about issues. We will look at data about bullying, how that data is obtained, and the implications of it. Using that knowledge, we will create a survey to use with other students, gather some data, analyse the data, and report the findings. Our report will make recommendations.
Spaced Out
This unit explores the volume (in cubic units) of skyscraper constructions. Students investigate the most efficient way to pack cuboids in a confined space, and the relationship between millilitres and cubic centimetres
This unit leads to an application of the formula for the volume of cuboids, namely that the volume is found by multiplying the length by the height by the depth.
Volume of a cuboid (rectangular prism) is given by V=l×h×d. In general, calculating the volume of three-dimensional shapes requires measurements of those three dimensions.
In the application, different volumes are calculated by combining cuboids to make a variety of shapes. This reflects a common approach to finding volume (or area) by breaking up complicated shapes into simpler ones, for which the volume (or area) is easier to find.
The unit also leads to the discovery of the fact that 1000 cubic centimetres (1000 cm3) occupy the same space as one litre of water. One cubic centimetre (1 cm3) and 1 millilitre (1 mL) represent the same amount of space. In the metric system, the cubic centimetre is a unit of volume, that amount of three-dimensional space bounded by an object. The millilitre is a unit of capacity, the amount of liquid or gas that is contained in an object. The designers of the metric system connected the units for volume, capacity and mass using water. One millilitre (1 mL) of water has a volume of one cubic centimetre (1 cm3), and a mass of one gram (1 g).
The learning opportunities in this unit can be differentiated by providing or removing support to students, or by varying the task requirements. Ways to support students include:
The contexts used in the unit can also be adapted to cater for the cultural backgrounds and interests of students. Choose situations that are likely to be familiar to your students. The use of everyday packets and skyscrapers is likely to be motivating to many students. Packing cuboids might be more relevant in the context of packing the boot of a car for a week away or packing a suitcase. Filling a box with Christmas gifts for whānau in another destination, like Samoa, might appeal to some students. The volume of baskets (kete) could also be connected to learning about the traditional story Tāne ascends to the heavens, and learning about the varied purposes of kete (e.g. for storing food, as everyday bags, as a symbol of knowledge and resilience). Volume is also used to represent the size of appliances, like refrigerators and dishwashers. In a technology context, learning around volume could be applied to creating new containers for a product.
Session One
What is the same about the shape of all these packets?
Students will spot many commonalities that are all valid, e.g. made of cardboard, shaped like rectangles, six faces, etc. Focus the students’ attention on the shape features the boxes have in common. All five boxes are composed of six rectangles.
Is there a mathematical name for boxes of this shape?
Students may know that all the boxes are rectangular prisms, sometimes called cuboids. Look up the definition of a prism online. Something like this will be returned:
A prism is a polyhedron, with two parallel faces called bases. The other faces are always parallelograms. The prism is named by the shape of its base.
What does parallel mean? Where are the two parallel faces? (Look for two identical [congruent] faces at opposite ends)
What is a parallelogram? (Quadrilateral with two pairs of parallel opposite sides)
Discuss which of these solids is a type of prism.
Look for students to identify congruent ‘end’ faces (can be base and top) and parallelograms, usually rectangles, wrapping around the sides of the end faces. Prisms are named by the end faces. Slide one has a triangular prism. A cylinder can be classified as a type of prism, though it is the limiting case with an infinite number of rectangular faces.
Also consider the non-examples. Slide One has two pyramids (triangular and cone), curved surfaces (sphere), and some other polyhedra (octahedron and icosahedron).
Your task is to find out the largest number of little cubes each of your five boxes will hold. Label the boxes so you can refer to them.
What can you tell me about the size of this cube?
You may need to measure the edges of the cube with a ruler to convince them that it is a cubic centimetre. Show them how the unit size can be written as 1 cm3, and said as “one cubic centimetre”.
We write the size of this cube as 1cm3. What does the ‘3’ represent? (the cube is 1cm in all three dimensions, length, height, depth)
Fill and count → Create stacks → Create layers → Multiply whole number edge lengths
Does 8 x (5 x 5) give the same volume as 5 x (8 x 5)?
Invite suggestions about how the volume, in cubic centimetres, might be worked out. Ideas might include building a cuboid of similar size and counting the cubes (successful but inefficient), making one layer of the building, counting the cubes in one layer and using equal additions to make up the height of the building, and multiplying by the edge lengths. Highlight the efficiency of the edge length approach.
Session Two
In this session students attempt “The cereal box challenge”. Their task is to maximise the volume of a cereal box that can be made from A4 sized pieces of 1cm grid paper. You could adapt the learning in this session to reflect the current learning, and/or cultural makeup of your class. For example, instead of a “cereal box challenge” you could pose the problem as designing a pattern for a Wakahuia or Papahou (wooden containers used to hold personal taonga, or treasures).
Cardboard packaging is usually created by die cutting a template or net, creasing the template, then folding up the packet. Tabs are glued to hold the packet together. You might find a video online to illustrate the creation of packaging (search “How cardboard boxes are made”).
Sketch what you think the template of your packet would look like before folding and glueing. Be as accurate as you can. You will need to measure the edge lengths of the packet and draw the template the correct size.
Does the packet give volume information?
Most packets provide information about net weight, that is the mass of the contents. This can be quite misleading as often the contents are nowhere as much, by volume, as the packet.
Why do the manufacturers only provide weight information?
Most contents in packets compress as they settle from the time they were filled. This is particularly true when the packets are transported. Net weight does not change though volume does.
What were some considerations as you found the box with the greatest volume?
Students should discuss how changing an edge affects the length of other edges. They should also acknowledge the constraint of the 19cm x 28cm size of the paper, and how increasing the height of the box decreased the base, and vice versa. You might put three pairs of students together to check the volume calculations (call that volume auditing).
Some students might also consider the normal shape of a one-serve cereal box and opt for a less regular shape.
Session Three
In this session the problem is based on finding the most efficient way to pack a collection of cuboids (rectangular prisms) into a confined space. This skill has many real-life contexts that you may wish to use as a story shell, including packing the car boot for a holiday or groceries at the supermarket. The context of the NASA first space trip to Mars may create more interest. Space is at a premium on spacecraft and advanced technology is designed to be compact!
Tell the students to:
Students are likely to begin by calculating the volumes of the first three buildings and arranging the data in a table:
Session Four
Problem One:
What does ‘L’ mean when referring to a backpack or chilly bin?
Students may be familiar with L referring to the unit of capacity, the litre.
Surely that does not mean that the backpack is going to be filled with water. Why is the litre used as the unit?
The use of litre means that the measure is referring to the capacity of the backpack or chilly bin. Capacity is how much a container holds and usually refers to amounts of liquid or gas.
This is a one litre container. Estimate how many cubic centimetres are equivalent to one litre.
Who can make up the volume of one litre?
Students should recognise that gathering 1000 unit cube will be tiresome, and collect bigger units, such as flats that represent 100cm3. Ten flats have a combined volume of 1000cm3 and form a cube that is 10cm x 10cm x 10cm. If you have a large place value block cube that represents 1000cm3 you might present it then.
Students will need rulers and calculators to work out the capacity of their school bag. Encourage them to record their calculations so that it can be verified. After a suitable time, gather the class to discuss what they found out.
What is the average bag capacity for students in our class?
Problem Two:
The Just Juice Company wants a new carton that will hold exactly 330 mL of juice. Each edge of the new carton must be an exact number of centimetres long (e.g. it cannot be 4.75 cm long).
One possible carton would be 330 cm x 1 cm x 1 cm. Ask the students to imagine what that would look like and how we know it would hold 330mL. Suggest that this carton would not be very practical and invite them to design other cartons which are more appropriate.
Allow the students time to find several possible cartons and bring the class together to share their ideas. Focus on their use of the cuboid volume formula (width x breadth x height) and the application of factors in finding workable dimensions. For example, if 10 cm is to be the length of one edge then 330 ÷ 10 = 33 gives the product of the other two edge lengths. Therefore 10 x 3 x 11 are the dimensions of one possible carton. The possible carton sizes could be entered in a table, in a systematic way, to check if all possible cartons have been found. Spreadsheet formulae could be used to make calculations easier:
Other possible extension problems:
Which of those cuboids is most compact? Explain why.
Now make the cuboid that has each dimension doubled, that is, 4 x 6 x 8.
When the edges are doubled in length what is the effect on volume?
How does volume increase if you treble or quadruple edge length?
Investigate, and explain why this happens.
Dear family and whānau,
This week we have been looking at box shapes (cuboids). We can think of measuring the edges of a box to get the length, height, and depth. From those measures we can work out the volume of the box, possibly in units such as cubic centimetres.
Discuss with your student how they would find the volume of a box that you have at home.
Figure it Out
Some links from the Figure It Out series which you may find useful are:
Matariki - Level 4
This unit explores a variety of mathematical ideas, at Level 4 of the New Zealand Curriculum, in the context of Matariki. Matariki is a significant event in the New Zealand calendar and is celebrated in many schools. Matariki is an opportunity to engage in activities such as storytelling, astronomy, song, dance, and visual arts that have potential to enrich students’ mathematical experiences in meaningful contexts. New Year is also a chance to honour our ancestors, show care for our natural environment, and celebrate our bi-cultural and multicultural heritage.
Session One
Session Two
Session Three
Session Four
This is an integrated unit which covers several important mathematical ideas. A summary of these ideas is discussed below.
Rotation is a transformation. A rotation is a turn that can be described as an angle about a given point and a direction of that turn. For example, Figure A has the Matariki cluster of stars in its most easily recognised position. Figure B shows the same cluster turned 90° clockwise.
Mathematically we are interested in the features of the figure that stay consistent as it is rotated. These features allow us to spot the cluster however it is orientated. Distances between stars (as we see them) stay the same as does their position relative to each other. A trapezium connecting four stars will stay the same shape as the figure rotates.
Sessions one and three deal with relationships between variables. Variables are changeable quantities, for example, as year changes so does the date of Matariki. Associating changes in variables is an important idea in mathematics as it is the foundation of functions. Relationships can be represented in a variety of ways, including tables, graphs and rules. At level 4 students are not expected to generate formal algebraic notation for their rules, although many students will be capable of, and interested in, doing so. For example, a tukutuku panel might grow like this:
Each kaho (horizontal rod) has three tuinga (cross-stitches) so the pattern is easy. The data could be organised in a table or a graph.
The number of tuinga increases by three for each extra kaho so the relation is linear. The graph shows points of a straight line. Rules for the pattern take two forms, recursive and direct or function. Recursive rules tell what is done to one term to get the next, in this case “add three”. A direct rule states how to get the value of one variable from the value of the other, in this case ‘multiply by three’. Direct rules tend to be more powerful than recursive rules though they can be hard to find for some patterns.
Session four involves percentages as operators. That means the percentages are used to scale (shrink or increase) the lengths of a template. Suppose we had a simple template like this. You need to put a mark 60% along the line.
The location of the 60% mark is dependent on the length of the whole line (100%). If the space between 0 and 100% is 30cm than the 60% mark is at 18cm (30 x 60 = 18). If the line is 40cm long the 60% mark is at 24cm. Useful strategies to find a percentage mark are to use 10% as a unit, or find the unit rate (i.e. what 1% is). 10% is found easily by dividing the length by ten and the unit rate is found by dividing the length by 100.
This unit is an integrated unit aimed at outcomes for Level 4 of the New Zealand Curriculum. As such, the activities range across the strands. All activities can be adapted to cater for the strengths and interests of students in your class. Ways to differentiate instruction might include:
Although the context of Matariki should be engaging and relevant for the majority of your learners, it may be appropriate to frame the learning in these sessions around another significant time of year (e.g. Chinese New Year, Samoan language week). You might ask students to share how New Year is celebrated in their culture and at what time of the year it occurs. Consider why our calendar New Year happens in the middle of summer, rather than winter, due to importing the calendar from the Northern Hemisphere. This context offers opportunities to make links between home and school. Make links to local and national Matariki celebrations. Consider asking family and community members to help with the different lessons. For example, members of your local marae, or a local kaumatua, may be able to share local stories and traditions of matariki with your class.
Te reo Māori language is embedded throughout this unit. Relevant mathematical vocabulary that could be introduced in this unit and used throughout other learning include tātai (calculate, calculation), huri (rotate, rotation), whakaata (reflect, reflection), neke (translate, translation, move), ture (rule), kauwhata (graph), tūtohi (table of data, chart), raraunga (data), koki (angle), taurangi (variable), putu (degree - angle and temperature), and maramataka (calendar).
Prior Experience
This unit is targeted at Level 4 so students are expected to have experience at Level 3 including:
Session One
In this session students investigate some of the mathematics of astronomy associated with the rising of Matariki. They learn to recognise the cluster of stars irrespective of orientation. They also learn where to look for the stars at the beginning of Matariki and how the date of the New Year is determined.
Use PowerPoint 1 to organise the lesson.
Matariki is a cluster that wanders the skies in relation to other star formations. For eleven months of the year it is visible as it wanders. In early May it disappears below the horizon and reappears close to the horizon in late May/Early June. The ‘rising of Matariki’ refers to its appearance above the horizon just before dawn. That is why it was used as a consistent marker to determine the New Year. So the first new moon following the ‘rising of Matariki’ is when the New Year begins, but celebrations occur in the last quarter of the lunar cycle before.
There are seven stars in the cluster visible to the naked eye, though another two stars can be seen by some with keen eyesight or with binoculars. As a cluster, the seven stars stay in the same formation like a squadron of stunt pilots. However, the cluster appears facing different directions at different times which can make it hard to spot.
The site will show the quarters of the lunar cycle like this:
You might ask the students to graph the relations, preferably using Excel or another app. The graph reveals a cycle like this that might predict future and previous dates for Matariki. The lines in this graph show the cycle even though the points are discrete (individual). The cycle is erratic, unlike a tide timetable or the pattern of seasons, because the timing of Matariki is dependent on two different patterns. The star cluster varies in the date it first rises each year, and the lunar cycle of 29.5 days does not match our calendar months.
Session Two
In this session students investigate the significance of Matariki as a time of remembering ancestors. Ask students to choose an ancestor of their own who has passed in the last year or select a famous New Zealander from an online database. They look at data about the deceased, particularly the nature of the contribution the ancestor has made to the lives of others.
Dr Mātāmua shows how the star Matariki is at the bow of the great canoe Te Waka o Rangi. The rising of Matariki signals a time of letting go of the dead from the year before so their souls can be gathered in the trawling net by Taramainuku who casts them into the heavens. In that way our ancestors become stars.
Ask, “Why does it say biological whakapapa?” Children do not always live with their parents and sometimes adults find new partners. So the problem has been simplified. Some children have brothers and sisters, and cousins. Great Aunts and Uncles are also referred to as tīpuna.
So the total number of ancestors in a biological whakapapa is 1023 after ten generations.
These numbers are powers of two and can be written in index notation, e.g. 32 = 25. Note that 25 can be written as 2 x 2 x 2 x 2 x 2 (two multiplied by itself five times).
Students might notice that the Column C numbers are one less than double Column B, e.g. 1023 = 2 x 512 – 1.
The result is surprising as it only takes only 37 generations to get 137,438,953,471 ancestors. Note that you will need to custom format the cells to take large numbers before you fill down the table columns. If each generation is 25 years apart then there are 4 generations in each century.
1023 is about 1000 so 100 000 000 000 ÷ 1023 ≈ 100 000 000 (one hundred million)
Students should create categories like family, sport, arts, leadership, business, education, to sort the people into. The person might belong in several categories. For example, Henare might have been a politician as well as a leader.
Session Three
In this session students follow the connection of Matariki as a time to honour the dead and the responsibility of the living to strive for excellence. Matariki occurs in the middle of winter. Traditionally this was a time when adequate food was stored and whānau engaged in cultural pursuits like story-telling, games, creating art works, and singing. So it is appropriate for students to learn about the mathematics of tukutuku panels that adorn the wall of wharenui (meeting houses) of marae. Students look at a traditional design called kaokao. Toothpicks could be for students to communicate and refine their thinking around patterns and rules. Use PowerPoint 3 to organise the lesson.
"Take two off the number of kaho, multiply the answer by four, then add two” can be written as , where t is the number of tuinga and a is the number of kaho.
In general her rule is, “Take one of the kaho number and multiply it by two. Multiply that answer by two then subtract two” or 2[2(k-1)]-2=t.
For 18 kaho Kahu will make 18 x 4 = 72 tuinga, then subtract six to get 66 tuinga. In general his rule is “Multiply the kaho number by four then subtract six” or 4k-6=t.
Session Four
Matariki was traditionally a time when kites were flown. Some iwi believe that flying kites helps us to get closer to our ancestors whose souls are embodied as stars in the sky. In previous times kites were made from everyday materials, toetoe, raupō and harakeke (flax).
This YouTube video shows examples of traditional manu tukutuku (kites):
Dear parents and whānau,
Our next mathematics unit is based on Matariki in recognition of the celebration of the Māori New Year. We will investigate mathematics in the astronomy of Matariki, how the date is decided and how to recognise the cluster of stars in the dawn sky.
We will also learn about the significance of whakapapa, our family tree, and the mathematics of our descendants as we go back generations. A famous tukutuku design will help us learn some algebra and we will finish off using percentages to build kites to fly at the Matariki celebrations.