Late level 3 plan (term 3)
Fraction Benchmarks
In this unit students develop important reference points or benchmarks for zero, one half and one. They use these benchmarks to help compare the relative sizes of fractions, through estimating, ordering and placing fractions on a number line.
- State which of two fractions is larger.
- Explain why a fraction is close to 0, 1/2 or 1.
This unit builds on the following key conceptual understandings about fractional parts.
- Fractional parts are equal sized parts of a whole or a unit. A whole or unit can be an object or a collection of things and is counted as "1".
- Fractional parts are named by the number of equal parts that are needed to make a unit. For example, fifths require five equal parts to make a one (whole unit).
- The more fractional parts used to make a whole, the smaller the parts. For example, tenths are smaller than sixths.
- A fraction tells us about the relationship between the part and the whole, or about the relationship between two parts.
An understanding of fractional parts supports students to develop a sense for the size of fractions. This unit helps students develop an intuitive feel for zero, one-half and one, as useful benchmarks for ordering fractions. Understanding why a fraction is close to zero, one half or one helps students develop a number sense for fractions.
Students can be supported through the learning opportunities in this unit by differentiating the complexity of the tasks, and by adapting the contexts. Ways to support students include:
- providing a physical model, particularly Fraction Strips (length model), or regions and area models (e.g. cubes, counters, etc.), so students can see the relative sizes of fractions
- connecting lengths from zero with the number line, and recognising that the space between zero and one is always visible on a number line for whole numbers
- discussing, and explicitly modelling the use of mathematical vocabulary and symbols, particularly the role of numerator as a count, and the denominator as giving the size of the parts counted
- encouraging students to work collaboratively (mahi-tahi) and share their ideas
- altering the complexity of the problems by simplifying the difficulty of the fractions and whole numbers that are used. Begin with fractions, such as halves, quarters, thirds, and fifths that students may be most familiar with.
The contexts for this unit are purely mathematical but can be adapted to suit the interests and cultural backgrounds of your students. Fractions can be applied to a wide variety of problem contexts, including making and sharing food, constructing items, travelling distances, working with money, and sharing earnings. The concept of equal shares and measures is common in collaborative settings. Students might also appreciate challenges introduced through competitive games or through stories.
- Fractions recorded on squares of paper
- Number lines marked with a 0 and 1
- Fraction Strips
- Copymaster 1
Session 1
In this session students begin to develop benchmarks for zero, half and one.
- Write the following fractions on the board:
1/20, 6/10, 10/8, 11/12, 1/10, 3/8, 2/5, 9/10.
As the difficulty of this task depends on the fractions, begin with fractions that are clearly close to zero, half or one. - Ask the students in pairs to sort the fractions into three groups: those close to 0, close to 1/2 and close to 1.
- As the students sort the fractions, ask them to explain their decisions.
Why do you think 6/10 is close to half? How much more than a half is it? Why do you think 1/20 is close to zero? How much more than zero? Why is 11/12 close to one? Is it more or less than one? How much less? - As the students explain their decisions encourage them to consider the size of the fractional parts and how many of these parts are in the fraction. For example, "9/10 is 9 parts and the parts are tenths. If we had one more tenth it would be 10/10 or 1 so 9/10 is very close to 1".
- Use Fraction Strips to physically model each fraction, if needed. Locate the fractions on a number line using the one unit as the space between 0 and 1.
- Repeat with another list of fractions. This time use fractions that are further away from the zero, one half, and one benchmarks so students need to think more carefully about their decisions:
3/10, 5/6, 5/9, 4/9, 18/20, 13/20, 2/8, 9/12, 1/5
Once more encourage the students to explain their decision for each fraction. - Add 1/4 and 6/8 to the list of fractions. Ask the students which group each fraction fits into. Use Fraction Strips to support students to understand why these fractions are exactly in between the benchmarks. Locate the 'between' fractions on the number line you created previously.
- Challenge the students to work in pairs, and develop a story that demonstrates how different fractions are close to 0, close to 1/2 and close to 1. Students could use the fractions provided in the earlier questions, or come up with a new list of fractions to use (or for another pair of students to use). This opportunity to investigate fraction benchmarks, in a relevant and meaningful context, will help to reinforce students’ understandings and can be used as formative assessment. During this task, take the opportunity to work with smaller groups of students and rectify any misunderstandings. At the conclusion of the session, pairs of students could be challenged to solve the questions created by other pairs of students.
Session 2
In this session the students continue to develop their sense of the size of fractions in relation to the benchmarks of zero, half and one by coming up with fractions rather than sorting them.
- Ask the students to name a fraction that is close to one but not more than one. Record this on the board. For example:
5/6
How do you know that fraction is close to one? - Next ask them to name another fraction that is closer to one than that. Record on the board:
5/6 7/8
How do you know that 7/8 is closer to one than 5/6?
Students might comment on how much needs to be added to each fraction to make it equal to one. "7/8 is closer to one because eighths are smaller parts than sixths and 7/8 is 1/8 smaller than 1 and 5/6 is 1/6 smaller than one. As 1/8 is smaller than 1/6, 7/8 is closer to one." - Continue for several more fractions with each fraction being closer to 1 than the previous fraction.
Do you notice a pattern as the fraction gets closer to one? (5/6, 7/8, 9/10, 11/12)
Which fraction is closer to one 99/100 or 999/1000? Why? - Repeat with fractions that are close to 0 but still greater than zero.
Which of these fractions is closest to zero, 1/3, 1/4, 1/5, or 1/6? Explain why?
Can a fraction have 5 as a numerator but still be close to zero? Give an example. - As the students nominate fractions encourage them to give explanations that focus on the relative size of the fractional parts.
- Ask the students to work in pairs. Direct one student from the pair to record a fraction that is close to, but under, 1/2 on a piece of paper. The other student then records a fraction that is closer to 1/2 and explains why it is closer. Encourage the pairs to continue to record fractions that are progressively closer to 1/2. Consider pairing more knowledgeable students with less knowledgeable students to encourage tuakana-teina.
- As the pairs work, circulate checking that they are expressing an understanding of the relative size of the fractional parts.
Session 3
In this session students estimate the size of fractions.
- Draw the representation below on the board. Ask the students to each write down a fraction that they think is a good estimate for the shaded area shown.

Ask for volunteers to record their estimate on the board. As they record estimates, ask each student to share their reasoning. Listen, without judgement to the estimate and then discuss why any given estimate might be a good one. Encourage students to share their justifications and ask questions of each other. There is no single correct answer but the estimates need to be reasonable. If the students are having difficulty, encourage them to reflect on the benchmarks developed in the previous sessions. Look for creative methods like estimating that the white area combines to 1/4 so the shaded area must be 3/4 - Repeat with some of the following shapes and number lines.
- Ask the students to work in pairs. Direct one student from each pair to draw a picture of a fraction and the other student to give an estimate with an explanation. Repeat with the students taking turns drawing and giving estimates.
- Broaden the selection of shapes that students find fractions of. Include symmetric polygons like hexagons and octagons, as well as circles and other ellipses (ovals).
Session 4
In this activity students identify which fraction of a pair is larger. The comparisons rely on an understanding of the top and bottom number (numerator and denominator) in fractions and on the relative sizes of the fractional parts. Equivalent fractions are not directly introduced in this unit but if they are mentioned by students they should be discussed.
- Write the following two fractions on the board and ask the students to tell you which is larger.
2/5 or 2/8
Encourage explanations that show that the students understand that the fractions have the same number of parts but that the parts are different sizes. In this example 2/8 is smaller than 2/5 because eighths are smaller than fifths. Some students may know that 2/8 = 1/4. Use Fraction Strips to check students predictions. - Write the following two fractions on the board and ask the students to tell you which is larger.
4/5 or 4/6.
Encourage explanations that show that the students understand that both these fractions have the same count (numerator) but fifths are larger than sixths. Therefore 4/5 is greater than 4/6. Write 4/5 > 4/6. Use Fraction Strips to check students' predictions. - Repeat with 5/8 and 7/8. In this case the size of parts is the same (the denominator) but the number of parts (numerator) is different. Record 5/8 < 7/8 or 7/8 > 5/8. Check with Fraction Strips, if needed.
- Repeat with 10/9 and 9/10.
In this example the students can draw on their understanding of the benchmark of 1 and notice that 10/9 is larger than 1 and 9/10 is smaller than 1. - Give the students pairs of fractions and ask them to make decisions about which fraction is larger. Support students with fraction strips if necessary but encourage prediction before using the materials.
7/10 or 6/10
6/8 or 6/12
3/8 or 4/10 (more difficult)
9/8 or 4/3 etc - Provide students with this open challenge.
One fraction is greater than the other.
The two fractions have different numerators and different denominators.
What might the fractions be?
Session 5
In this session the students draw on their conceptual understanding of fraction benchmarks (0, 1/2, 1) and their understanding of the relative sizes of fractional parts to line fractions up on a number line.
- Ask students in pairs to draw five fractions from a "hat". Suitable fractions are available on Copymaster 1. Their task is to put the fractions in order and also to locate the fractions on a number line that is marked 0, 1/2, 1 and 2. Support students with Fraction Strips but only if necessary.

- Ask the students to write a description of how they decided on the order for the fractions and where to place them on the number line. When placing the fractions on the number line, students should justify their choice with logical arguments. For example, three tenths is closer to one half than zero because 3/10 is 2/10 away from 5/10 and 3/10 away from zero.
- Ask each pair of students to join with another pair to see if they agree with one another’s order and placement of fractions.
Dear family and whānau,
This week we are learning about where fractions live on number lines. We have been especially interested in fractions that are close to zero, close to one half and close to one. Ask your child to put the following fractions on a number line and explain to you how they made up their mind about where to place them.
1/30 2/99 44/85 99/100 25/60 3/25 77/80 26/50
Breakaway Bars
This unit explores the relationships between fractions and decimals. A decimat model is used to explore how fractions arise from equal sharing and how the decimal place value system is a restricted form of equal sharing. The main objective is to link students’ knowledge of fractions with the decimal system.
- Represent common fractions as decimals and vice versa.
- Relate decimals to decimat models that represent their size and composition.
- Combine and partition decimal place values to flexibly add and subtract decimals.
This unit builds on the idea that the need for fractions and decimals arises from division situations, in which ones (wholes), do not give an adequate degree of precision. Lack of closure of a whole number under the operation of division creates the need for rational numbers. The division situations can be either partitive (sharing) or quotative (measuring). In this unit sharing of a decimat model is used to connect fractions and decimals.
Specific Teaching Points
Decimals are a restricted form of equivalent fractions. For example, three quarters is represented in decimals as 0.75 because 3/4 = 75/100. As with whole numbers the place values in decimals are connected although separate columns are used to write numbers. For example, 0.75 has can be expressed in different decimal forms, such as 7 tenths and 5 hundredths, 75 hundredths, 750 thousandths, 7.5 tenths, etc. Flexibility in the way students think about decimal place value supports their fluency with calculation. Central to fluency is students’ understanding of how decimal place value units can be partitioned and combined. For example, 2.3 – 0.7 requires a one in 2.3 to be partitioned into 10 tenths if subtraction is used, or 10 tenths to be combined to form a one if adding on from the 0.7 is used.
The learning opportunities in this unit can be differentiated by providing or removing support to students and by varying the task requirements. Ways to support students include:
- providing physical materials (e.g. decimats), so that students can anticipate actions, model their thinking, and justify their solutions
- connecting decimat models with symbols,
- using calculators to confirm answers, and to look for counting patterns, e.g. 0.5, 1, 1.5, 2, …
- using important mathematical vocabulary to discuss concepts, in particular words for fractions (numerator, denominator) and decimals (tenths, hundredths, thousandths, etc.), and equality/equivalence
- encouraging students to collaborate in small groups and to share and justify their ideas
- altering the complexity of the fractions and decimals that are used. Fractions that can be expressed as tenths and hundredths are easier than those requiring thousandths or further decimal places. Recurring decimals like 0.333... may provide a significant challenge for more knowledgeable students.
The context for this unit is chocolate bars. Students usually find the context engaging. Sharing food is a common practice across cultures worldwide. Investigating the origins of chocolate will lead to finding out about Aztec culture from Central America. However, using foods as a context is sometimes not appropriate for students. In that case, use a context that is relevant and appropriate to your students. For example, the story could be changed to reflect different situations about area (e.g., land, kumara patches), precious sheets of gold or tablets of clay (as in an Indiana Jones film), or space available on school fair tables. Vary the context while retaining the important decimat model.
Te reo Māori vocabulary terms such as taurea (multiply), whakawehe (divide), hautau waetahi (unit fraction), hautanga ā-ira (decimal fraction), and hautanga ā-ira (equivalent fraction) could be introduced in this unit and used throughout other mathematical learning.
Prior Experience
Students would benefit from previous experience with fractions. In particular, they would benefit from experiences of partitioning of areas to form equal parts and the naming of collections of those equal parts as non-unit fractions. This unit uses an area model, the decimat, that is based on tens frames used for whole number place value. It is expected that students will understand whole number place value in a flexible way. They are expected to see place value as a nested system. Within this, they should understand that place value units are nested in others. For example, 23 tens are nested within 230. Therefore, 230 can be renamed as 23 tens. It is also expected that students will have a range of strategies for solving addition and subtraction problems with whole numbers, that include using standard place value (hundreds, tens and ones, etc.) and tidy and/or compatible numbers (rounding and compensating).
Session One
- Show the students a copy of the Breakaway Chocolate bar (Copymaster 1). You may like to house paper copies in the coloured sleeve provided so the chocolate bar looks more authentic. Ask the students why the bar might be suitable to share between two or ten people as is claimed on the wrapper. Students might say that the bar is about the right size or it divides easily into two or ten equal pieces. Slide out the paper ‘bar’ and ask the students what they notice about the snap lines. Discuss how the lines might be used to share a bar into either halves or tenths.
So imagine we share the bar equally among ten people, how much bar does each person get? How could we record this mathematically? - Students may need to connect to story shells such as “Bindi's family collects 24 kūtai (green-lipped mussels) from the beach. The mussels need to be shared equally amongst the 6 family members. How many mussels should each person get?” Similar problems may support students' understandings of the chocolate sharing being expressed as division.
Ways to express the division answer quotient are: 1÷10 = 1/10 or 1÷10 = 0.1
(A scientific calculator provides both decimal and fraction answers) - Ask the students to express the sharing between two people as division: 1÷2 = 1/2. “What is the decimal for one half?” Most students know that 0.5 is the decimal for one half though many are unaware of why that is true. “If two people share the bar, how many tenths do they get each?” (five tenths - half of the bar). So the five in 0.5 means, 5 tenths. So, 1÷2 = 5/10 = 0.5 . You may need to use the pattern of dividing by ten to extend the decimal places to the right beyond what your students are used to.
- Extend the problem by asking, “What would happen if ten people shared three of these bars equally?” You may need to act out the fact that each person could get one tenth from each bar. So the sharing could be recorded as 3÷10 = 3/10 or 3÷10 = 0.3. Consider whether the students can generalise that starting with any number of bars gives the number of tenths each person receives, i.e. n÷10 = n/10?
- Also generalise the same pattern for halves:
- 2÷2 = 2/2 and 2÷2 = 10/10 = 1.0
- 3÷2 = 3/2 and 3÷2 = 15/15 = 1.5 etc.
- Put the students into small groups of two or three with the following problem:
Are there other numbers of people that the Breakaway Chocolate bar could be shared equally among? Remember that the bar can only be broken along the snap lines.
Are there numbers of people that it could not be shared amongst using the current design? - Ask: What could the people at Breakaway Chocolate do about that?
- Provide the students with scissors and copies of Copymaster 1 to work with. Students may benefit from working in pairs. Rove and watch for the following:
- Do the students realise that factors of ten (1, 2, 5, 10) give the number of equal shares that the bar can be broken into? So five people will get two tenths each.
- Can they record their findings as equations? I.e. 1÷5 = 2/10 and 1÷5 = 2/10 = 0.2
- Can they record their findings as equations using different representations of decimals (e.g. 0.2, 2/10)?
- Do they realise that other numbers of shares are only possible with more snap lines?
- Do they realise that halving halves gives quarter shares? Do they connect quarter shares to decimals, i.e. 1÷4 = 1/4 and 1/4 = 25/100 = 0.25?
- After a suitable period of group work bring the class together to share the key ideas above. After some discussion ask if the Breakaway Block could be improved to cater for different numbers of equal shares. Note that quarter shares cannot be created with the snap lines on the current design. Tell the students that they will need to improve the design tomorrow.
Session Two
- Remind the students that with the bar divided into ten equal parts only two, five and ten equal shares were possible. The restriction caused complaints to the Breakaway Bar Chocolate Company. The managers decided to provide a free calculator with every bar to help their customers to share equally. Type in 1÷5= on a calculator, preferably on an interactive whiteboard or using a data projector. You may wish to support students in estimating the answer through drawing a diagram of a chocolate bar divided into five pieces.
What does the answer tell us about how much chocolate each of the five people should get?
Expect the students to recall that 0.2 means two tenths so each person gets two pieces. You may like to act out breaking up a paper bar to support the students to understand the quantities involved. - Say: let’s see if the calculator can help.
Type in 1 ÷ 4 but do not press the equals sign. Ask the students to predict the answer then confirm to get 0.25. “So how much of a bar is that?” Provide a paper bar partitioned in tenths so students can tell you what they think 0.25 means and looks like. Usually, students suggest this idea for equal partitioning.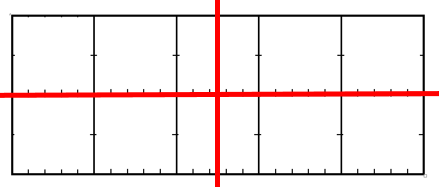
- We can see that each quarter has two tenths. That explains the 0.2 in the answer but what does the five digit refer to?
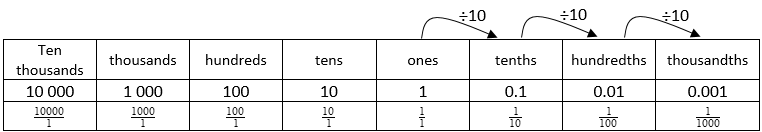
Students might suggest that five means one half of a tenth in the same way ‘point five’ means one half. Ask, “What does the place value chart from yesterday say about the place value of where the five is?” Students should see that the five refers to five hundredths. “But how big is one hundredth on our chocolate bar?” Students may suggest ways to partition the bar but the key idea is that tenths are divided into ten equal parts, as suggested by the arrows on the place value chart.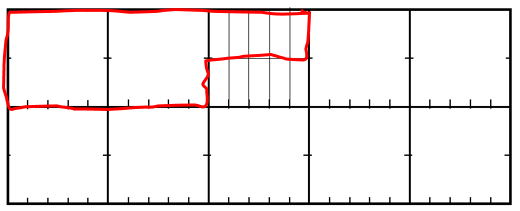
- Highlight that if a tenth is cut into ten equal bits there must be 10 x 10 = 100 of those pieces in one. That is why they are called hundredths. One quarter is made up of two tenths and five hundredths which correspond to the answer of 1÷4 = 0.25.
- Continue the story. “The Breakaway Chocolate Bar Company designed a new bar to go with the free calculator.” Produce the new improved bar (Copymaster 2). Challenge the students, “Is it possible to break this new bar into the numbers of equal shares they claim? For example, how will you divide the bar into eighths, or into thirds? Are other numbers of equal shares possible?”
- Let the students work in groups of two or three to investigate. They will need scissors, copies of Copymaster 2, and a calculator. Encourage the students to experiment with the physical bar first before using the calculator to check their predictions. Look for the following:
- Do they realise that hundredths can also be partitioned into ten equal parts called thousandths?
- Do they realise that the ‘tenth-ing’ could continue infinitely to make smaller and more precise place value units?
- Do they note that thirds are not exactly possible with tenths, hundredths, thousandths, etc. as there is always a unit remaining after the sharing?
- Do they relate the physical model of sharing in place value units to the display from dividing with the calculator?
- Do they realise that if making thirds is problematic then sixths, ninths, twelfths, etc. also results in recurring, non-terminating decimals?
- If some students finish early, challenge them to predict the decimals for sixteenths, thirty-twoths (or one thirty-second), etc. What do they predict will be the decimals for one ninth? one eleventh? one seventh? Bring the class together to discuss the bullet points above. Is the new bar an improvement? Is the claim on the packet correct or misleading?
Session Three
- Begin this session with a matching activity to improve the fluency of students to recognise common fractions and their equivalent decimal representations (see Copymaster 3). Students should work on grouping the words, symbols and decimat models for common fractions. Paper copies are sufficient and students can create a record by gluing the matching cards together on an A3 sized poster. " I have, who has" could be used to extend students.
- After the matching task, ask the students, “Was one fraction different to the others? Why was it different?” Three-quarters was the only non-unit fraction, that is, the only number with a numerator greater than one. Ask, “So how did you decide what the decimal for three quarters is?” The key idea is that non-unit fractions, like three quarters, are formed by joining (iterating) unit fractions. So you might like to record this as:
1/4 + 1/4 + 1/4 = 3/4. The decimal equivalent of this is 0.25 + 0.25+ 0.25 = 0.75 - You might also like to show this as three lots of 0.25 made from decimats being joined. An interesting point is “Why is the decimal not zero point six fifteen since 3 x 2 = 6 and 3 x 5 = 15?” Recognising that ten hundredths form another tenth is an important principle that students should transfer from whole numbers, e.g. ten hundreds form one thousand in the same way that ten thousandths form one hundredth. Continue adding 0.25 to your model. Ask the students to predict the new decimal, use a calculator to confirm the result, and invite the students to explain why this happens. Why 0.75 becomes 1 is particularly interesting, especially as many calculators do not display the decimal point. In this scenario ten hundredths are renamed as one tenth and ten tenths are renamed as one.
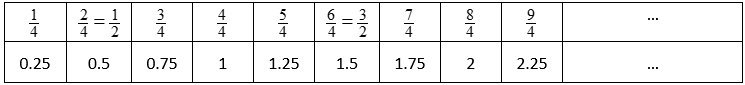
- Create a sequence of counting in quarters, or sets of 0.25, promoting the link between fractions and decimals as you go. See if students recognise the equivalence, e.g.
- Ask the students to work in groups to find the fraction names for the following decimals.
3.5 0.7 1.8 0.625 2.6 0.873
There are an infinite number of possible fractions for each decimal so tell the students that many answers are possible. Support the students to justify their answers and support their justification with decimat models. Provide paper decimats, scissors and calculators for each small group. - Early finishers can challenge other students by creating their own decimal to fraction task. Look for the following:
- Do the students connect their knowledge of decimals for unit fractions to converting decimals to non-unit fractions? E.g. 0.7 is 7 x 0.1 so it is seven tenths.
- Do the students create appropriate decimat models to justify their answers? E.g. 3.5 should be shown as seven lots of five tenths.
- Do they know that a ‘dot’ over a digits or group of digits indicates infinite recurrence of those digits?
- Do they know that decimal place value also provides a fraction name for decimals? E.g. 0.873 = 873/1000 and 1.8 = 18/10?
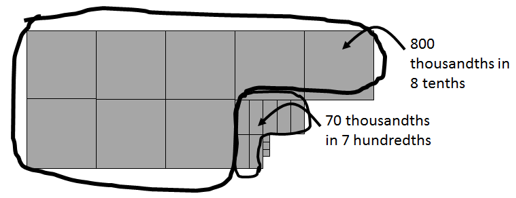
- Share the group answers as a class highlighting the important points above. In the case of the last point you may need to use decimat models to show how the decimal place values are ‘nested’ in one another. For example, with 0.873 where are the 873 thousandths located?
Session Four
The aim of this session is to connect addition and subtraction of decimals with the place value understanding students have built up over the previous three lessons.
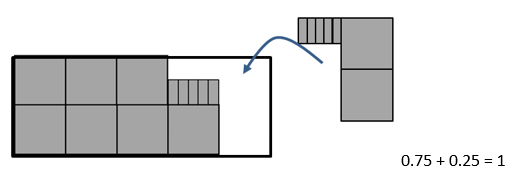
- Begin with the Stan and Kayla story (Copymaster 4) in which two children share three quarters of a Breakaway Bar. What fraction of one bar might each person get?
The simplest answer is for Stan to get one half of a bar and Kayla to get one quarter. Make a decimat model to illustrate that break up beginning with three quarters, 0.75.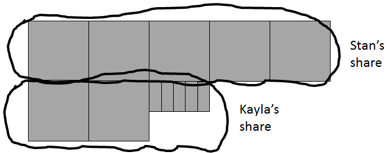
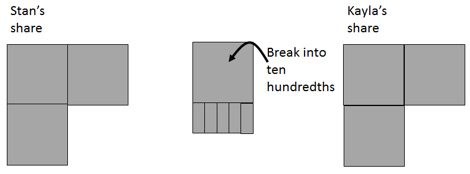
- Ask how this might be recorded mathematically. Look for various ways to express this partitioning such as:
1/2 + 1/4 = 3/4, 0.5 + 0.25 = 0.75, 3/4 - 1/2 = 1/4, 0.75 – 0.5 = 0.25, etc. - Ask, “What would happen if Stan and Kayla had equal shares?” Students may solve this problem using either fractions or decimals or both simultaneously. Consider how 0.75 can be equally shared to get 0.375 + 0.375. A physical decimat model will be very important so students can see how one tenth can be broken into ten hundredths and one hundredth can be broken down into ten thousandths.
Leads to…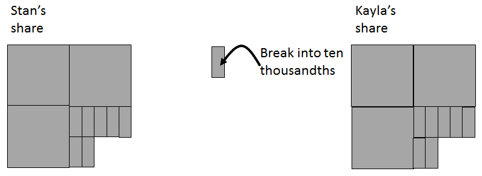
Leads to…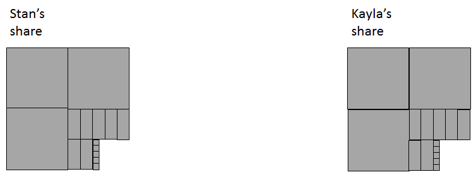
- Ask students how this partitioning might be recorded:
3/8 + 3/8 = 3/4, 0.375 + 0.375 = 0.75, 3/4 - 3/8 = 3/8, 0.75 – 0.375 = 0.375, etc. - Concentrate on the decimal representations, particularly 0.375 + 0.375. Ask, “Why does the answer (0.75) have only two decimal places when the addends have three decimal places?” Look for students to know that two sets of five thousandths form one hundredth. “If you add three tenths and three tenths you get six tenths. Why does the answer (0.75) have seven in the tenths place?”
- Challenge the students to come up with other fraction and decimal possibilities for Stan and Kayla to share three quarters of a Breakaway Bar. Emphasise the importance of recording the possibilities in multiple ways. Provide the students with copys of the chocolate bar, scissors and calculators. Look for the following:
- Do the students look flexibly at links between fractions and decimals?, e.g. If Stan gets four tenths (0.4) then Kayla must get 0.35 which is three tenths and five hundredths.
- Do they flexibly combine and partition decimal place value units?, e.g. 0.7 (seven tenths) I halved to get 0.35 (three and one half tenths or 35 hundredths).
- Do the students justify their answers using multiple sources of evidence?, e.g. Shares of 0.7 and 0.05 are substantiated using decimal fractions, the calculator, and the decimat model.
- Do capable students challenge themselves to extend the decimal system beyond thousandths?, e.g. Stan gets 0.4025 and Kayla gets 0.3475.
- After an appropriate period of investigation bring the class together to share answers. Recognise novelty in solutions and risk taking. For example, does any group make Kayla’s share one third which leads to 0.416 and 0.333? Highlight at least one solution where place value units are partitioned or combined.
- As a final individual assessment task ask the students to solve these two decimal calculations:
0.25 + 1.8 = ? 3.52 – 1.9 = ?
Look for students to apply their place value understanding and link fractions with decimals where appropriate. These addition problems could be a good opportunity for students to draw on their cultural backgrounds and daily lives and make the contexts of problems more relevant.
Dear parents and caregivers
This week we are beginning work on decimals. We will be using a paper model of a Breakway Chocolate Bar. Don’t worry we won’t be eating lots of real chocolate. The simplest chocolate bar is divided into ten equal parts like this:
By snapping the bar along the dark lines, the bar can be shared equally among two, five or ten people. The shares can be written as decimals and fractions, e.g. one fifth is two tenths or 0.2. This model will help us to explore the relationships between simple fractions and decimals. By the end of the week we may even be adding and subtracting decimals.
Building patterns
In this unit students work with growing patterns made from square tiles. Students represent the relationships between pattern number and number of tiles using tables, graphs and rules, in order to predict further terms of the pattern.
- Continue a linear growth pattern from a few examples.
- Find the recursive rule of a linear growth pattern from a table of values.
- Explain why the graph of relationships in the pattern is linear.
- Use the table and recursive rule, and/or the graph to make predictions about other terms of the pattern.
- Attempt to create a general rule that connects term number and number of tiles for any term of the pattern.
A linear number pattern is a sequence of numbers for which the difference between consecutive terms is always the same. If plotted on a number plane the graph of a linear pattern is a straight line.
A progression in the way students process linear patterns is well established in the research. That progression is as follows:
- Copy a spatial pattern with materials.
- Identify change and extend the spatial pattern with materials.
(Make the next term for the pattern). - Represent the relationship between term number and number of items and use recursive rules to predict further members.
(Find the number of items required to make the next term without needing to build it). - Use function (direct) rules to connect term numbers with number with the number of items.
(Find the number of items required to make any given term without needing to know the number for the previous term). - Reverse (direct) rules to find the term number for a given number of items.
(Given a number of items, find which term number would require that many).
Click to download a PDF with further information.
This unit is aimed at achievement of Level 3 in The New Zealand Curriculum, which requires students to develop recursive rules. Level 3 involves progression from phase 2 to phase 3 of the above progression.
The learning opportunities in this unit can be differentiated by providing or removing support to students and by varying the task requirements. Ways to support students to progress through the phases include:
- providing access to materials and restrictions on the terms for prediction. This makes the level of challenge appropriate for students that need to consolidate understanding of the first two phases. Asking for the number of items in the tenth member of a pattern is a good guideline
- providing support in representing the relationship between term numbers and the number of items, using tables, graphs and diagrams for students progressing to the third phase
- providing tasks that push beyond terms easily found with recursive rules for students progressing to the fourth phase (direct rules). Asking for the number of items for the twentieth, fiftieth, or hundredth term is a good guideline
- encouraging sharing and discussion of students’ thinking
- using collaborative grouping so students can support each other and experience both tuakana and teina roles
- encouraging mahi tahi (collaboration) among students.
The unit is based around patterns with square tiles, which is relatively context neutral. It may be that situations from real life motivate your learners. Attention could be given to growing patterns seen in Maori tukutuku panels and Samoan ngatu patterns. The patterns could be contextualised as buildings made of sections, stone paintings (kohutu peita), planting of trees, or fruit ripening in a tray. You might like to discuss situations in which everyday patterns grow in a consistent way, such as saving the same amount of money each week, planting the same number of native New Zealand trees each week, stacks of items in the supermarket, shoes related to the number of people, or chairs on a bus or aircraft.
Te reo Māori vocabulary terms such as tauira (pattern), pānga rārangi (linear relationship), and ture (rule, formula) could be introduced in this unit and used throughout other mathematical learning.
- Square tiles
- Calculators
- Copymaster 1
- Copymaster 2
- Copymaster 3
- Copymaster 4
- Copymaster 5
- PowerPoint 1
- PowerPoint 2
- PowerPoint 3
Getting started (Session One)
The unit begins by looking at the growth patterns of even and odd numbers. It is important that students ‘see’ even numbers as multiples of two, and odd numbers as multiples of two plus or minus one. The lesson also looks at generalisations about what happens when even and odd numbers are added.
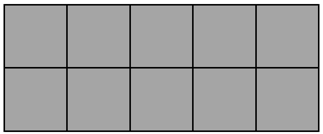
- Build the ‘factories’ in the diagram below, using square tiles, drink coasters, or similar square-shaped objects (PowerPoint 1, slides one and two). They could also be constructed digitally (e.g. on a PowerPoint).
How many squares make up the first factory? The second? The third? etc.
What is changing and what is staying the same as the pattern grows?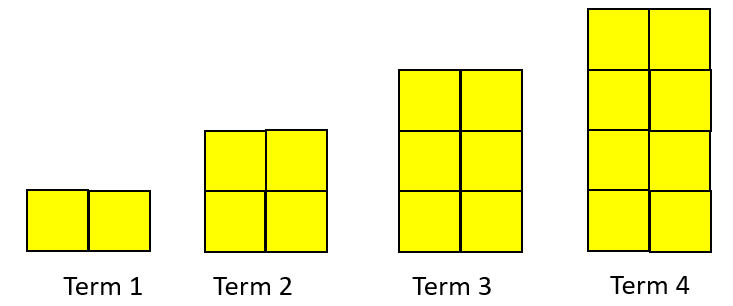
- Let students solve the next problem collaboratively using materials if need be. Their strategies will indicate their current achievement against the progression.
How many squares make up the tenth factory? - Ask the same questions for the pattern on slide two.
- Slide Three presents the two growing patterns on top of one another.
How are these two patterns related? (The terms in the second sequence (odd numbers) are one less than the first sequence.) Ask your students to create tables for the first four terms of each pattern. For example:
Term 1 2 3 4 10 Number of tiles 2 4 6 8 ? How could the table be used to find the number of squares in term 10?
- Students might notice that the number of tiles goes up by two for each increase of one in the term number. This recursive rule can be used to find any term in the pattern but requires a bit of work.
- If your students can use the ‘add two’ recursive rule to further the table pose the following challenge to encourage direct rules.
If you had to find the fiftieth term in the pattern would you use the ‘add two’ rule? Why not? How would you find the fiftieth term in each pattern? - Let your students collaborate in small teams. They might realise that repeated adding of twos is inefficient and suggest a direct rule, i.e. multiply the term number by two (even pattern) or multiply the term number by two then subtract one (odd pattern).
- Finally use Slides Four and Five to introduce the prediction of combining terms.
You might provide further examples for your students as scaffolding.
Can you predict the result if I join two terms?
How will you describe your method so someone else can use it? - For the even pattern the result of joining terms 3 and 5 is term 8. The general rule is “Add the term numbers and multiply by two.”
- For the odd pattern the result of joining terms 3 and 5 is term 7 in the even pattern (7 x 2 = 14). The general rule is “Add the term numbers, multiply by two, then subtract two.”
For students who develop the rule quickly provide these challenges:
- Kayla joins two terms in the even pattern and gets a total of 40 squares. What can you say about the terms she joins?
- Tipene joins two terms in the odd pattern and gets a total of 40 squares. Which terms might he join?
- Hana finds a rule for joining a term in the even pattern with the same term in the odd pattern. What is her rule?
- If an odd term is taken away from the same even term, how many squares remain? Why?
Session Two
In this session students use a spatial pattern made with square tiles to investigate how relationships that exhibit constant difference are represented with graphs.
- Show your students PowerPoint 2, slide one, which shows a growing pattern. Ask students what they notice about how the pattern grows from one term to the next.
- Ask students: Can you imagine what Term Ten looks like? Describe it to a partner.
Look for students to anticipate ten empty spaces or squares surrounded, on all sides, by square tiles. - Ask students to work with a partner to predict how many square tiles they would need to build Term Ten.
Look for students to:- Use the element of growth to extend the pattern physically (with tiles) or diagrammatically
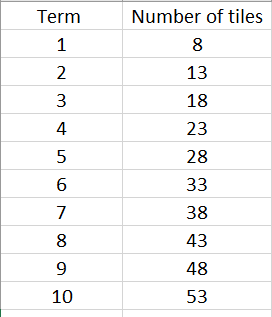
- Use a table and notice that there is a constant growth of five tiles between consecutive terms
- Extend the repeated addition of five to calculate that 53 tiles are needed
- Use multiplicative direct rules such as 8 + 9 x 5 or 3 + 10 x 5 to find the number of tiles
- Be prepared to extend students who use direct rules with challenges like:
Why do the different rules like 8 + 9 x 5 or 3 + 10 x 5 give the same number of tiles?
How many tiles are needed to make Term 20? Is that twice as much as Term 10? If not, why not?
If you had 998 tiles, what term could you make? Explain. - Share the strategies students used to create term Ten. Discuss efficiency. Go to a spreadsheet or online graphing tool, such as Desmos. Create a table of data from the students’ earlier work. You might highlight using the drop-down capability to repeatedly add five easily.
- Ask students how they might graph the relationship.
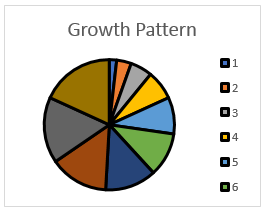
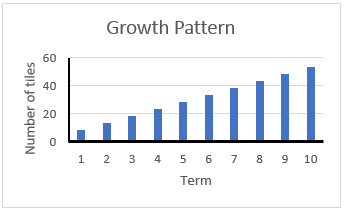
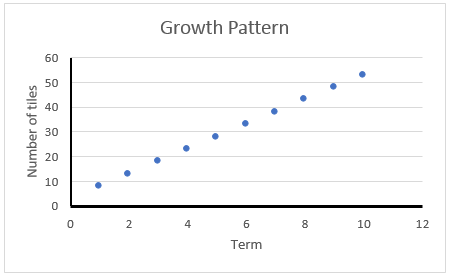
Students might suggest using a familiar type of display, like a bar graph. Use the spreadsheet to create the graphs they suggest. If they do not suggest a scatter plot then make that your choice.
Which graph best shows how the pattern grows?
What do you notice about that graph? - Note that the pie chart is not very useful. Both the bar graph and scatter plot show the constant growth.
- If your students have digital devices you might send them away to create their own graphs. There is also considerable merit in them creating the graphs by hand as they will need to attend to scale, axis labels, location of points and heights of bars.
- Gather the class and focus on the scatter plot. Draw students’ attention to specific points and ask what the coordinate represents (an association between a term number and the number of tiles).
As you go up one in the term, how many tiles do you go up by? (five)
How does this “up five” rule show on the graph? (The points are in a straight line)
How could we use our graph to predict the number of tiles for Term 20? (extend the line and see what point matches Term 20- See PowerPoint 2, Slide 2)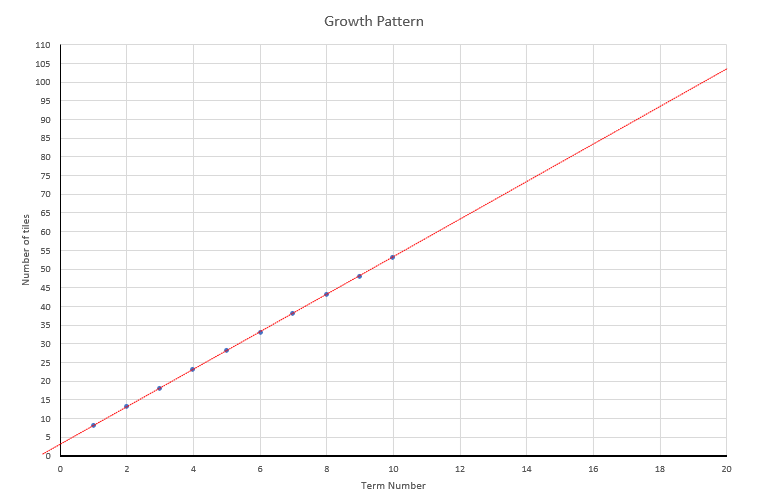
What does this point (20, 103) tell us?
How accurate is this method? Where can it go wrong? (Slope must be exact) - Ask students to find the value of Term 20 using a line on their graph.
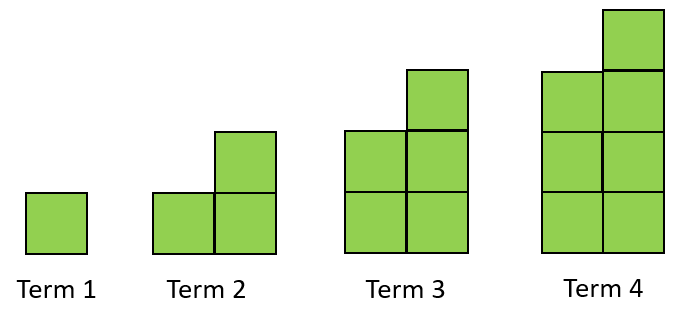
What other terms can you read off from your line? (e.g. Term 15 equals 78) - Introduce Copymaster 1. The pattern is like the previous one in that it grows in a block fashion. However, the constant difference is six rather than five. Slide Three allows you to display the ‘new’ pattern.
- Talk through the requirements of Copymaster 1 then let your students solve the problems in collaborative groups of three or four. Use Slide Four to discuss what each student, Teina, Phillip or Cameron, ‘sees’ in the pattern for Term Four (colour coded).
What would each person write for Term 10? … for Term 30? … for any term number?
Which person’s rule is the most efficient to use? Why?
Session Three
- Use Copymaster 2 to set out six stations for your students to complete. Letting them work independently, or collaboratively in small groups, provides you with an opportunity to observe what students do and interact with them to support their progression. Make sure students have access to square tiles and square grid paper (e.g. exercise book) to support them. You might choose to develop workshops for students who feel they need help with graphing, creating tables, or developing rules. Students should use online graphing packages or spreadsheets to graph the relationships, as well as manually drawing the graphs.
- The answers to each Station are given at the end of Copymaster 2. Expect your students to show agency by checking their own answers, addressing errors, and identifying areas in which they need further support. You might set up a chart for them to indicate whether, or not, they have control of the specific learning outcomes. Copymaster 3 provides an empty template for this:
● Not yet ? Maybe P Yes
| Continue a linear growth pattern from a few terms. | Make a table of values. | Draw a graph. | Use a table or graph to find a term in the pattern. | Create a rule for finding any term in the pattern. |
Annie | P | P | P | P | P |
Tariq | P | P | P | P | P |
Tipene | ? | ? | ? | P | P |
Vey-un | ● | ● | ● | P | P |
Sione | ● | ● | ? | P | ? |
Session Four
In this session you differentiate the class into two groups, those that feel they need more help with patterns, and those who think they can attempt a challenging pattern investigation independently.
- Give the more confident group Copymaster 4 to work on independently or in small groups. Note that numbers 2 and 3 provide enabling prompts for students to support their independent investigation. Students should read the prompts if they are stuck, rather than interrupt your teaching group/s.
- Use PowerPoint 3 with the other group to introduce a structured approach to predicting further terms in a growth pattern. Work through the slides progressively. Points to note are:
- Predictive rules can come from seeing patterns in tables of values and/or structure in the figures, e.g. four arms that grow
- Different ways of seeing lead to different rules
- Rules for any term can be found by looking for similarities among specific terms
- With linear relations graphs can be used to predict further terms.
- After a suitable period, bring together the two groups to share their learning. Bring out the similarity of the two problems, which are both applications of linear relationships.
- Students could work collaboratively on problems from Visual Patterns for further practice.
Session Five
Copymaster 5 provides a task that can be used to assess your students. They will need access to a calculator. You might also provide the students with square grid paper to make sketching the yacht pattern easier.
Let your students work independently and use the data to check their achievement against the criteria in Copymaster 3. Students might exchange worksheets so you can mark the task collectively.
Dear parents and whānau,
This week in algebra we have been looking at patterns made with squares tiles and how these patterns can be continued. We have looked at different ways to predict how the patterns continue. A recursive rule tells you how to go from the number of squares in one figure to the number of squares in the next. A general rule is a rule that gives you the number of squares for any term in the pattern.
Making benchmarks: Volume
In this unit we will explore the idea of having benchmarks of 1 litre and ½ litre or 500 millilitres, to aid in estimating the volume of given objects.
- Use objects of 1 litre volume/capacity to estimate the volume or capacity of other objects.
- Understand the need for standard measures of volume and capacity.
- Make sensible estimates about the volume and capacity of given objects.
- Carry out conversions between standard measures of volume and capacity (cubic centimetres, cm3, to cubic decimetres, dm3, and millilitres, mL to litres, L).
Volume is the measure of space taken up by a three-dimensional object. The space within a container is known as its capacity but as the thickness of many containers is negligible, it has become acceptable to refer to the space inside a container as volume too. In the measurement strand of the New Zealand Curriculum, volume and capacity are used as interchangeable terms (although the glossary describes capacity as the interior volume of an object).
Students need to develop personal measurement benchmarks. A benchmark is an understanding or a “feel” for the size of a measurement unit, which is useful when working with measures in daily life. Often these benchmarks are linked to familiar items such as a one litre milk bottle or a Pyrex jug.
This unit supports students to develop personal benchmarks for 1, 100 or 1000 cubic centimetres, 1 litre and ½ litre, and also strengthens students’ understandings of the relationship between litres and millilitres. Milli is the prefix for 1/1000 so 1 millilitre (1 mL) is 1/1000th of 1 litre and has a volume of 1 cm3.
The learning opportunities in this unit can be differentiated by altering the difficulty of the tasks to make the learning opportunities accessible to a range of learners. For example:
- providing a smaller number of containers for students to work with, and ensure there are clear differences in the volumes of the containers provided
- providing opportunities for students to measure the volume of containers to confirm whether they hold more, less, or about the same as 1 litre after their initial estimates.
- providing opportunities for students to use fractional parts of 1 litre to describe volume, rather than millilitres e.g., one quarter of a litre rather than 250 ml.
This unit is focussed on measuring the volume of containers. Use a range of objects and containers that are familiar to your students to encourage engagement. Suitable examples are tissue boxes, cereal packets, Milo or biscuit tins, milk or fruit juice bottles, and toy buckets.
Te reo Māori vocabulary terms such as mehua (measure), rita (litre), kītanga (capacity), rōrahi (volume), whakatau tata (estimate), mita pūtoru (cubic metre), mitarau pūtoru (cubic centimetre) and ritamano (millilitre) could be introduced in this unit and used throughout other mathematical learning.
- Waterproof objects of a variety of volumes. Cardboard boxes can have a plastic bag inserted in them to hold water.
- Various bottles including several that hold 1 litre, e.g., milk bottle, fruit juice, shampoo.
- Place Value Blocks, including the large cube.
- Plastic bags (snaplock if possible)
- Measurement jugs
- Scrap cardboard, scissors, rulers and tape.
Session 1
For this session you will need plenty of bottles and containers of a range of sizes, including several that hold 1 litre. Fruit juice bottles, shampoo bottles, and yoghurt containers are particularly good containers for this task. You could either ask students to bring bottles and containers to school with them or collect them yourself. To ignite interest in this session, begin with a discussion around why it is important to know the amount that can be held in a container/ Possible contexts for framing this discussion could include looking at the ways in which people travelled to New Zealand (e.g. by ship, waka, plane etc.) or looking at planning the amount of food and drink needed for a school camp.
- Begin by selecting 5 or 6 containers of various sizes and shapes.
- Ask students which one they think has the least space in it. Introduce the word 'capacity' to mean the space within a container, and 'volume' as the amount of liquid or gas a container holds. Explain that although these terms mean different things, they are often used to talk about the same thing. It would be wise to choose one term to use with your class, throughout the sessions in this unit. Ask them to explain why they made their choice of container with the smallest capacity.
- Explain that we are going to order the containers from those that hold the least, to those that hold the most.
- Ask for suggestions for how to compare the size of the containers. Ensure that students understand that they are comparing the space inside the containers.
- Gather suggested strategies then trial strategies to establish an effective way to order the containers by volume. The most effective strategy will probably be to pour water from one container to another. If the water that fits in one container does not fit into another then the first must have been larger. Discuss how to organise the containers, given that only two can be compared at one time in that way.
- Group students and provide them several containers for each group. Ask each group to order their containers by capacity, from 'holds the least' to 'holds the most'. Watch to see that your students can organise the ordering of many containers, when the comparisons are two at a time. Consider grouping students together that have a range of mathematical abilities to encourage tuakana-teina (peer learning) and mahi tahi (collaboration)
- Share the techniques and strategies used by each group to order the containers.
- Ask 2 groups to pair up to combine their containers on one continuum of least to most volume. Check that they understand that volume is conserved (i.e. that it is the same quantity of water, even though its appearance may change in a different shaped bottle) and that the order of each group’s containers will not change by adding another group’s containers.
- Establish an order for all the containers available. This task raises efficiency and estimation. Suppose ten containers are already ordered by capacity.
What is the most efficient way to find the place of this (new) container amongst the others?
Students might suggest estimating first to get a ‘ballpark’ idea of where the new container might go. Next, compare the capacity of the new container to the others by pouring. How many pourings are needed? - An additional challenge can be to anticipate the water level if water is poured from a smaller container into a larger container. Rubber bands can be used to mark the predicted levels. Look for students to discuss strategies for anticipating the levels, such as considering the cross sectional area of the container.
Session 2
The following activities are to provide students with experiences to compare volumes/capacities of different objects and to create a benchmark for a container that holds one litre.
- Make a 1 litre container available for students to use to give them a ‘feel’ for one litre.
Compare it to a large Place Value Block cube.
Which object takes up the most space, that is, has the greatest volume?
The visual appearance of the large cube makes it look smaller than most other objects with the same volume of 1 litre (1000 cm3). It is fun to fill a bucket of water to the brim and ‘dunk’ the containers one at a time. The water that overflows is equivalent to the volume of the container or cube. - Group students and provide a variety of containers for each group. Ensure items that hold 1 litre (like a 1 litre measuring jug or a 1 litre container of milk or water) are included as such items will become useful benchmarks.
- Ask each group to draw and label the following buckets on large sheets of paper.
- Students work together to place the containers in the most appropriate bucket, then check their estimates using a 1 litre container. Be aware that interpretation of "lee than", "about", and "more than" is a bit subjective.
Gather the class and discuss the strategies students used to make their estimates. Consider the following points:
Do taller objects have more volume than shorter objects?
How does the cross-section affect the volume of the object?
If you have an object that you know is 1 litre, how do you compare its volume to that of an object that has different height and cross-section?
Provide students with this open challenge. They need scrap cardboard, scissors, rulers and strong tape.
Create a cuboid (rectangular prism), cone, or cylinder shaped container that can hold exactly 1 litre of water.
You may need to support students with creating nets, rolling pieces of card to form cones or cylinders, and applying their understanding of the fact that 1 litre equals 1000 cubic centimetres.
- Ask students to locate items from around their home that they believe would make good benchmarks for 1 litre and, if possible, bring them to school.
Session 3
In this session students compare their benchmarks for one litre and try to estimate one litre.
- Share the containers that have been brought to school as good benchmarks for 1 litre and identify which are closest to 1 litre in volume.
- Discuss which of the benchmarks are the most useful. For example, objects which you don’t usually see are not particularly good benchmarks as you will not be familiar with their volume. Common objects are easier to visualise.
- Give students a plastic bag and ask them to put one litre of water in it. Vary the size of the bags you use. You may prefer to do this activity outside.
- Compare the bags and discuss differences in appearance.
We know that all the bags hold 1 litre but they look different. Why is that?
Compare the bags to reliable benchmark objects. - Introduce millilitres as a unit that is helpful for measuring containers that hold less than a litre.
- What does milli stand for?
- How many millilitres equal 1 litre?
- How many millilitres equal 2.5 litres?
- How many litres equals 1500 millilitres?
You might use a small place value block to give students a sense of the size of 1 millilitre.
How many millilitres will fill a teaspoon? (5mL)
....a dessert spoon (10 mL)?
....a tablespoon (20 mL)?
Show the students a Place Value Block flat.
How many millilitres is this? (10 x 10 = 100)
How many lots of 100 millilitres make 1 litre? (10 since 10 x 100 = 1000)
Stack ten flats to form a large 1 litre cube to prove the result.
- Take several containers, measure the capacities, and express the measurements using both millilitres and litres, e.g. 750ml = 0.75 L. Discuss why 750 mL is the same as 750/1000 of 1 litres and is written as 0.75
Provide the students with some conversion examples between millilitre and litre measures, such as:
Millilitres Litres 500 mL 1 L 250 mL 750 mL 300 mL 0.3 L 900 mL 1200 mL 456 mL 0.456 L 685 mL 903 mL 0.728 L
Session 4
In this session students work with volume as the amount of space that an object takes up.
- Provide a range of familiar objects of different volumes (preferably things that will sink in water). Make sure all items are waterproof. Bath toys make good objects.
- Ask students which of the objects has the largest volume. If there is confusion, explain that volume does not just mean the amount that a container can hold, it also means the amount of space an object takes up.
- Show students how they can find the volume by displacement. Place a container full of water inside an empty container or tray. Submerge the object in the container of water and measure how much water is displaced (overflows) into the empty container. This is equal to the volume of the object – discuss why this is so with the class. If you can find a copy, read ‘Mr. Archimedes' Bath ’ by Pamela Allen.
- Allow students some time to experiment with this concept and to order objects by volume. Discuss the importance of considering all three dimensions, not just one dimension such as height.
- If you have plasticine available pose open challenges like:
Make a blob that has a volume of 48 cm3 which is the same volume as 48 mL.
Change the volume to provide more challenge, e.g. 0.124 L.
Session 5
- Bring this unit to a conclusion by asking students to share the benchmarks they are going to use for 1 litre.
- List the various benchmarks on a large sheet of paper to be displayed as a reference.
- Share the various strategies and techniques students have developed to establish near estimates for objects they are asked to estimate the volume of.
- Ask students to think about other possible accessible items that could be used as benchmarks to measure items that are less than 1 litre in volume.
What is the volume of a can of soft drink?
Why might that volume be a good ‘size’?
What is the volume of your lunchbox?
Why might that volume be a good ‘size’?
What would be a good volume for a chilly bin? - School bags and backpacks are often measured in litres to indicate the capacity of the bag. Research standard backpack sizes online to find out the usual dimensions.
Why is the capacity of a backpack important?
How many litres is your backpack in capacity?
Use the large Place Value Block cube as the benchmark of 1 litre to estimate the students' backpacks.
Dear family and whānau,
At the start of this week we would like each child to bring a plastic container or empty bottle to school. We are collecting containers of as many different sizes and shapes as we can. During the week, draw your child's attention to the labels of containers around your home and ask them to tell you the capacity of the containers in litres or millilitres.
If possible, do some baking with your child. Recipes usually include standard measures of weight and volume, such as grams (g) and millilitres (mL).
Morning tea volumes
In this unit students build on previous experiences with litres and millilitres. Work is carried out in the context of planning a morning tea with students measuring volumes accurately as part of the planning process.
- Estimate volume using litres and millilitres.
- Accurately measure volume using litres and millilitres.
When students can measure areas effectively using non-standard units, they are ready to move to the use of standard units. The motivation for moving to this stage, often follows from experiences where the students have used different non-standard units for the same volume. This allows them to appreciate that consistency in the units used allows for easier and more accurate communication.
For example, when building a sandcastle, students may have used a variety of cups and vessels to investigate what volume of sand can be held in the different containers. This allows them to appreciate that consistency in the units used allows for easier and more accurate communication.
It is important to note a mathematical difference between capacity and volume. Volume describes the amount of space occupied by a three-dimensional liquid, solid, or gas object (how much juice can fit into this container?). In comparison, capacity describes the space within a container (how much juice can this container hold?). In the measurement strand of the New Zealand Curriculum, the terms volume and capacity are used interchangeably. In the glossary of this document, “capacity” is defined as the interior volume of an object.
When learning about volume, students should have opportunities to explore the question “how much space does a three-dimensional object occupy?”. Students should also have opportunities to measure volume by measuring fluids. The volume of a cuboid can be calculated by multiplying together its width, length, and height (l x w x h = volume). Volume is measured cubic centimetres and cubic metres. However, the usual sequence used in primary school is to introduce the litre as a measurement of volume, before introducing cubic units.
Students’ measurement experiences must enable them to:
- develop an understanding of the size of 1 litre and 10 millilitres. (1 millilitre is very small and difficult to appreciate, however it can be demonstrated with an eyedropper)
- estimate and measure using litres and millilitres
- develop an understanding of the size of a cubic metre and a cubic centimetre
- estimate and measure using cubic metres and cubic centimetres
Students also need to be able to read a range of scales to accurately measure volume .
The standard units can be made meaningful by looking at the volumes of everyday objects. For example, the litre milk carton, the 2-litre ice-cream container and the 100-millilitre yoghurt pottle.
The learning opportunities in this unit can be differentiated by varying the scaffolding provided to make the learning opportunities accessible to a range of learners. Ways to support students include:
- providing students with scaffolded practice at using equipment to measure volume
- making it clear to students that they don’t need to measure the volume of every container at a station if they need more time to measure accurately
- removing the component of estimation for students who are still developing measurement benchmarks
- using buddy systems where learners are encouraged to help each other
- creating an environment that offers all students the opportunity to fill both tuakana and teina roles
- encouraging sharing and discussion of students’ estimations and measurements. Is there variation? Why might this be?
- extending students with questions such as, ‘If each packet of jelly made 1 litre how many packets would be needed for each bowl? How many packets would be needed for all the bowls? (station 2), and ‘If each person uses 15mL of sauce, how many people will be able to use each of the sauce bottles?’ (station 5)
- extending students with discussions about the range of variation in the measurements made. What is the range of measurements for one of the bowls in Station 2, for example? What is the range of values that are considered to be an accurate measurement?
The context for this unit can be adapted to suit the interests and experiences of your students. The unit begins with a discussion of students’ experiences of morning tea with their whānau. Following this discussion you could work with the students to adapt the activities and contexts at the stations to reflect their experiences. Alternatively, you may like to choose a social gathering other than morning tea with whānau as the context for the measuring tasks. For example, the school disco, or a birthday party, a fiefia night, preparing a hāngī or another important cause for celebration and gathering.
Te reo Māori vocabulary such as mehua (measure), kai (food), rita (litre), and ritamano (millilitre) could be introduced in this unit and used throughout other mathematical learning.
Station One:
- A variety of different size and shape drinking glasses, kitchen measuring jugs or measuring cylinders marked to the nearest 10 mL
- Water
- Paper and pencil
- Student instructions on Copymaster 1
Station Two:
- A variety of different size and shape bowls
- Kitchen measuring jugs or measuring cylinders marked to the nearest 10 mL
- Water
- Paper and pencil
- Student instructions on Copymaster 2
Station Three:
- Lightweight cardboard, pencils, rulers, scissors, sticky tape
- Kitchen measuring jugs or measuring cylinders marked to the nearest 10 mL
- Sand
- Paper and pencil
- Student instructions on Copymaster 3
Station Four:
- Several different cake tins of a variety of shapes and sizes: ring tins, square tins and a roasting dish
- Kitchen measuring jugs or measuring cylinders marked to the nearest 10 mL
- Water
- Paper and pencil
- Student instructions on Copymaster 4
Station Five:
- Several bottles of different volumes to be used as sauce bottles
- Kitchen measuring jugs or measuring cylinders marked to the nearest 10 mL
- Water
- Paper and pencil
- Student instructions on Copymaster 5
This unit uses the context of morning tea with whānau. Begin by discussing students' experiences of of morning tea and compare differences between families. Explain that this week they will be working at different stations to help prepare for a of morning tea. This may be an event that you’d like to plan and invite students’ whānau to.
Note: It’s important not to use food for purposes other than food.
Points that may need to be discussed as work progresses include:
- The importance of estimation and the value of accurate estimation.
- The relationship between millilitres and litres.
- Reading volumes and scales to an appropriate accuracy. Sometimes it will be possible to estimate half-way between marked volumes.
Station One
In this station students accurately measure the volume of a variety of different drinking glasses. You may wish to begin by modelling the measurement of the volume of a liquid. This could start with measuring the volume of water in millilitres and litres. Discuss where students have read or heard of the terms “millilitres” and “litres”. You may wish to make a list of objects in the classroom that show these measurements (e.g. drink bottles). Ensure that your students can read the scale of the provided measuring vessels accurately, and understand the relevant abbreviations (l or L for litres and ml or mL for millilitres). This could be modelled by the teacher, or pairs of students could work together to develop a set of rules for measuring volumes.
Student instructions (Copymaster 1)
In this station you need to estimate and measure the volume of different glasses for drinks at the morning tea.
Estimate the volume of each of the glasses in mL. Record your estimates.
Which glass do you think will hold the most?
Which will hold the least?
Which glasses will hold a similar amount?Use the measuring equipment to measure the volume of each of the glasses. Record your results in a table as you work.
Compare your results with your estimates. How close were your estimates?
Which glass held the most?
Which held the least?
Which glasses held a similar amount?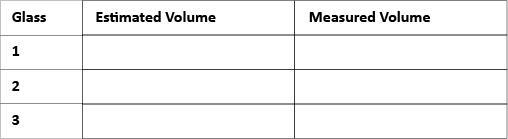
Encourage discussion around why some learners estimated the volume of liquids differently.
Station Two
In this station students accurately measure the volume of a variety of bowls that could be used to make jelly.
Student instructions (Copymaster 2)
In this station you need to estimate and measure the volume of different bowls used to make jelly for the morning tea.
Estimate the volume of each of the bowls. Record your estimates.
Which bowl do you think will hold the most?
Which will hold the least?
Which bowls will hold a similar amount?- Use the measuring equipment to measure the volume of each of the bowls. Record your results in a table as you work.
Compare your results with your estimates. How close were your estimates?
Which bowl held the most?
Which held the least?
Which bowls held a similar amount?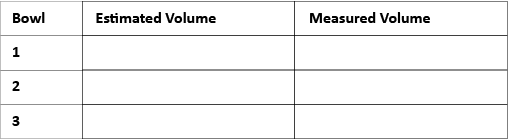
If each packet of jelly makes 1 litre how many packets would be needed for each bowl?
How many packets would be needed for all the bowls?
Share and discuss your estimations and measurements with another pair or group. What is the same? What is different? Why might this be?
Station Three
In this station students make baskets to hold chips and measure the volume of the baskets they have made.
Student Instructions (Copymaster 3)
In this station you will make baskets to hold chips for the morning tea and measure the volume of the baskets you have made. Can you make three baskets that hold different amounts?
- Make a basket: Take a rectangular shape and cut squares of the same size out of each corner of the rectangle. Cut out the shape and tape up the sides. Cut a strip for a handle and tape it on.

- Estimate the volume of your basket. Record your estimates on a table.
Which basket will have the greatest volume?
Which will have the least? - Measure the volume of your baskets using the sand and the measuring equipment.
How do you work out the volume of a box, like that?
If you know the volume of the box in cubic centimetres, how do you figure out how much water in millimetres and litres, it will hold?
Record your results in a table as you work. Compare your results with your estimates. How close were your estimates?
Which basket held the most?
Which held the least?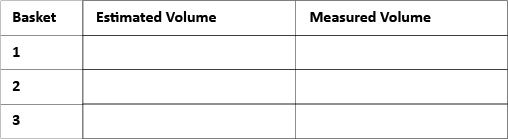
Station Four
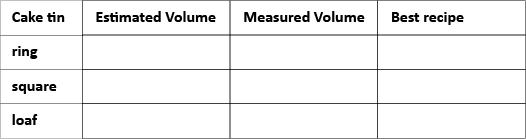
In this station students measure the volume of a variety of cake tins and predict which recipe would be best to use for each tin.
Student Instructions (Copymaster 4)
In this station you need to measure the volume of the different cake tins, then decide which recipe mix would be best for each tin. Remember that the cakes will rise when they are cooked!
- Estimate the volume of each of the cake tins. Record your estimates on a table.
- Measure the volume of each of the cake tins using water and the measuring equipment. Record your measurements.
Compare your results with your estimates. How close were your estimates?
Which tin held the most?
Which held the least?- Which of the recipes below would be best for each tin? You will need to add up the volume of ingredients and allow for the cake to rise when baked to be able to make a good decision.
Recipes
Absurdly Easy Chocolate Cake
Ingredients
3 cups flour (750 mL)
2 cups sugar (500 mL)
6 tablespoons cocoa (90 mL)
2 teaspoons baking soda (10 mL)
1 teaspoon salt (5 mL)
3/4 cup vegetable oil (190 mL)
2 tablespoon vinegar (30 mL)
2 teaspoon vanilla (10 mL)
2 cup cold water (500 mL)
Directions
Mix the dry ingredients. Add the wet ingredients. Stir until smooth. Bake at 180ºC for at least 30 minutes.
One Mix Chocolate Cake
Ingredients
1 cup self raising flour (250 mL)
1 cup sugar (250 mL)
50 grams melted butter (50 mL)
1/2 cup milk (125 mL)
2 eggs
2 Tbsp. cocoa (30 mL)
1 tsp. vanilla (5 mL)
Method
Mix all ingredients together in a large bowl with a wooden spoon. Bake at 180ºC for about 30 minutes.
Daisy’s Easy Chocolate Cake
Ingredients
1 1/2 cups sugar (375 mL)
1 cup cold water (250 mL)
125g butter (125 mL)
2 Tablespoons cocoa (30 mL)
1/2 teaspoon baking soda (2.5 mL)
2 eggs, well beaten
1 1/2 cups self-raising flour (375mL)
Method
Put sugar, water, butter, cocoa and soda into a large pot.
Stir over low heat until butter has melted, then bring to the boil.
Simmer for 5 minutes and remove from heat.
When mixture has cooled, stir in beaten eggs. Sift in the flour and beat well.
Bake at 180°c for 50-60 minutes.
Station Five
In this station students calculate and measure the volume of sauce needed for cheerios at the morning tea.
Student Instructions (Copymaster 5)
- In this station you need to estimate and measure the amount of sauce needed for cheerios at the morning tea.
- Estimate the volume of sauce in each of the bottles. Record your estimates on a table.
- Measure the volume of sauce in each bottle using water and the measuring equipment. Record your results on a table.
- If each person uses 10mL of sauce, how many people will be able to use each of the sauce bottles? Estimate then measure for each bottle, recording your results on a table.
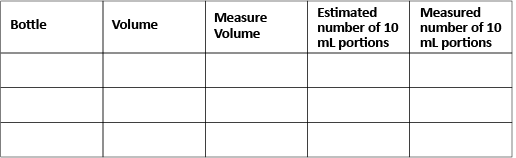
- If each person uses 15mL of sauce, how many people will be able to use each of the sauce bottles?
- How much sauce is contained in all of the bottles put together? Estimate then measure.
Family and whānau,
This week at school we are estimating and measuring volumes using litres and millilitres. Please help find a container in your home with an estimated volume of 600 ml. Please send it to school so we can measure its volume accurately.
Dividing fractions
The purpose of this series of lessons is to develop understanding of the connection between division and fractions. In the unit both types of division, sharing and measurement, are explored to establish a need for fractions and to develop generalisations about division and fractions.
- Apply the understanding that fractions can be quotients (i.e. the result of division), e.g. 3 ÷ 5 = 3/5.
- Model and represent division problems with fractions that involve a measurement or sharing interpretation of division.
- Write and solve division problems that involve fractions.
Students need to understand and use the appropriate mathematical language for the numbers and symbols in division equations. Students need to understand and apply addend plus addend equals the sum for addition, and factor (multiplier) times factor (multiplicand) equals product for multiplication. Mathematical language for division allows for clear definition of the symbols, i.e., the meaning of those symbols, and allows for succinct expression of generalisations. In division, the dividend is partitioned by the divisor and this results in the quotient.
a (dividend) ÷ b (divisor) = c (quotient)
Division models the operation of equal partitioning in two different, but connected, types of situations. The first situation is sharing or partitive division, which often involves answering the question, “If a objects are equally shared among b parties, how many objects does each party get?” The second form of division is the measurement interpretation (sometimes referred to as quotative division). Here the number in the group, or size of each measure is known. That group or quantity becomes the unit of measure. The unknown in measurement division, is the number of those units that can be made from a given amount. This interpretation is often associated with repeated subtraction, as one way to solve this kind of problem is to keep removing the given equal groups (measures) from the whole amount, until nothing is left. Counting each repeated subtraction gives the solution to the question.
Measurement division situations are the easiest contexts for division by fractions. Problems with division by a fraction involve finding how units of a given (i.e. fractional size) ‘fit within’ another fraction quantity. For example, 1 1/2 ÷ 1/4 is interpreted as how many units of one quarter measure 1 1/2?
When students carry out the operation of division with whole numbers, their expectation is that the quotient will be smaller than the dividend, for example, 20 ÷ 2 = 10, and sometimes smaller than both the dividend and the divisor, for example, 20 ÷ 5 = 4. It is a conceptual shift for students to come to understand that when they are dividing a fraction by a fraction the quotient may be larger than both the dividend and the divisor, for example 1/2 ÷ 1/4 = 2.
There are many real-life occasions when we divide fractions by fractions, however, the fractions are frequently presented as decimals in measurement situations. For example, if you pay $15.00 for three quarters of a kilo of prime lamb and you want to know the price per kilo, that will involve you dividing a whole number by a fraction, i.e. 15 ÷ 3/4 =$20. Providing simple fractional problems in context, and asking students to consider and create their own contexts, is helpful to their connection of mathematics to the real world.
Links to the Number Framework
Stages 7 - 8
This unit supports and complements the learning activities in Book 7 Teaching Fractions, Decimals and Percentages.
Students can be supported through the learning opportunities in this unit by differentiating the nature and complexity of the tasks, and by adapting the contexts. Ways to support students include:
- providing a physical model, particularly of discrete objects (cubes, counters, etc.), and fraction strips so students can represent relationships and their thinking
- modelling how to represent division problems with fractions diagrammatically and with equations
- using mathematical vocabulary to identify common features in situations and the equations that represent those situations
- seeking generalisations of properties of operations from whole numbers, and applying the generalisations to fractions
- encouraging students to work collaboratively, and share their ideas.
Task can be varied in many ways including:
- Alter the complexity of the problems by simplifying the difficulty of the fractions and whole numbers that are used. Begin with fractions, such as halves, quarters, thirds, and fifths that students may be most familiar with.
- Provide access to physical representations so students can make sense of the actions in a situation, alongside using symbols.
The contexts for this unit can be adapted to suit the interests and cultural backgrounds of your students. Fractions can be applied to a wide variety of problem contexts, including making and sharing food or land from inheritance, constructing items, travelling distances, working with money, and sharing earnings. The concept of equal shares and measures is common in collaborative settings. Be conscious that fair sharing is not necessarily equal in whānau or community groups, e.g., bigger families might get more of a share. In te ao Māori, the sharing of food with visitors reflects manaakitanga. Hākari (feasts) are often included as a part of the celebrations of special events. In Samoan culture, food is an important part of events (e.g. weddings, funerals, church celebrations). Food, like other forms of wealth, is often shared evenly amongst the aiga (extended family). The learning in these sessions could be linked to learning about the tikanga (customs) of sharing food in the different cultures reflected in your classroom. In turn, this could foster greater connections and understanding amongst your learners.
Te reo Māori vocabulary terms such as hautau waetahi (unit fraction), hautua (fraction, part of a whole), whakarea (multiply), whakawehe (division, divide), toharoha (share, distribute), rautaki tohatoha ōrite (equal sharing strategy) and ōrite (equal) could be introduced in this unit and used throughout other mathematical learning.
- Unifix (or interlocking) cubes, or counters
- Strips of paper
- Scissors
- Calculators
- PowerPoint 1
- PowerPoint 2
- PowerPoint 3
- PowerPoint 4
- PowerPoint 5
- Copymaster 1
- Copymaster 2
- Copymaster 3
- Copymaster 4
Consider adapting this problem to suit the context of your class. It could be reframed as 84 students are taking part in Polyfest this year. They stand in 6 rows, with an equal number of students in each row. How many students stand in each row?
Note that most of the fractions in these teachers’ notes are displayed as typed text, meaning that the vinculum (the line between the numerator and the denominator) is diagonal rather than horizontal. When writing fractions on the board or in students’ books it is recommended that you use a horizontal vinculum.
Session 1
Activity 1
- Begin this session by showing this problem (Slide One of PowerPoint 1). These problems could be adapted to reflect the current interests and cultural makeup of your class (e.g. instead of a sports day focus, the context could be 180 students visiting the marae. 12 students can fit in the school van. How many trips need to be made to transport all students to the marae?)
On school sports day there are 180 students. They are put into teams of 12 students. How many teams are made? - Ask students to solve the problem without a calculator, then discuss their strategies with a partner. Encourage your students to record their work, to ease memory load and as a way to communicate their strategies.
- Ask students to record the problem equation on the chart (15 x 12 = 180 or 180 ÷ 12 = 15) and explain their strategy to the class. (for example: 10 x 12 = 120, 5 x 12 = 60 (halving), 120 + 60 = 180, and 10 + 5 = 15).
Note that many students are likely to use ‘build up’ strategies to find a solution. This strategy involves creating sets of 12 students until the total is exhausted. Their approach might be additive (repeated adding of twelves) or multiplicative (tracking the number of twelves as 180 is approached). - Ask: Is there a single operation that tells how many twelves can fit into 180?
- Model 180 ÷ 12 = 15 with a calculator. Discuss what the symbols in the equation mean, including the numbers (dividend (180), divisor (12), quotient (15)) and the signs (“measured in” (÷) and “is the same quantity as” (=)).
- Change the problem slightly to read (Slide Two of PowerPoint 1):
On school sports day there are 54 students. They are put into teams of 12 students. How many teams are made? - Let students work on their solution individually then in pairs. Share a few strategies as a whole class and record equations, such as:
[ ] x 12 = 54
54 ÷ 12 = [ ] - You might act out the problem using linking cubes as students. Discuss how to deal with the ‘leftover’ students. Students might suggest changing the number of students so an exact number of teams would work.
How many students should be in each team? (teams of six and nine students work evenly because 54 is divisible by both 6 and 9) - Solve 54 ÷ 12 = 4.5 using a calculator.
What does “point five” mean? (0.5 is the decimal for one half)
What does 4.5 tell us about the number of teams that can be made? (Four teams can be made with one half of a team remaining) - Use Side Three of PowerPoint 1 to show how six is one half of twelve. In this problem a team of 12 players is the unit of measurement.
4.5 can also be written as 4 ½. - Provide another problem for students to solve (Slide Four of PowerPoint 1):
For the Basketball tournament there are 62 students. They are put into teams of 8 students. How many teams are made?
Students might use the basic fact 8 x 8 = 64 to recognise that nearly 8 teams can be made. 7 x 8 = 56 indicates that 7 full teams can be made with 6 students left over.
What fraction of a team of 8 players is that? (6/8 or 3/4)
What will the calculator say when I use division? What equation shall I enter? (62 ÷ 8 = 7.75)
Recognising that 0.75 equals three quarters or six eighths involves equivalent fractions that will be accessible to many students. - Use Slide Five of PowerPoint 1 to model the fractions.
6/8 = 3/4 = 75/100 = 0.75
Activity 2
- Provide your students with Copymaster 1 that contains a series of group worthy problems about division with remainders. Encourage students to work in pairs or threes. Consider arranging these pairs to include more and less mathematically-confident students. Some students may benefit from working with the teacher on the first few problems. Provide calculators, whiteboards or scrap paper, and cubes/counters for students who need extra support.
- Roam the room and look for the following:
- Do students use addition or multiplication build-up strategies, or do they apply their knowledge of multiplication and division facts?
- Can students treat the team size as the unit of measure?
- Can students name the remainder as a fraction of the unit of measure?
- Do students connect the remainder, as a fraction, and the decimal they get from the calculator entry?
- After a suitable time, bring the class together to discuss their answers. Particular points to focus on are:
What question do you ask yourself to solve each problem?
For example, Question Two might be answered by “How many tens are in 93?”
How do you find the number of teams as quickly as possible?
How do you name the remainder as a fraction?
What kinds of numbers always have a remainder when divided into teams? (Primes) - Write on the class/group chart and pose this, or a similar question.
At the junior school sports day there are 86 students. If there are 7 in each group, how many groups are there? - Have students work in pairs. Tell them that their task is to solve the problem, discuss their strategy and write down how this problem is different from the first problem and suggest (show) how a younger child might solve the problem. Set a short time limit.
- Summarise the types of problems students have been solving.
What is the same about all the problems you have solved?
Aim to support students to understand that the situations have all involved measurement division. The team size is the unit in all problems, the divisor, and the total number of players is the dividend.
What does the answer, quotient, represent? (The number of teams)
Session Two
In this session students explore division as sharing into equal parts. They learn that sharing situations can also be answered using measurement division.
Activity 1
- Use Slide One of PowerPoint 2 to introduce this problem:
There are 84 students in Learning Environment Three.
The teacher wants to sort all students into six equal teams for the quiz.
How many students should be in each team?
Consider adapting this problem to suit the context of your class. It could be reframed as 84 students are taking part in Polyfest this year. They stand in 6 rows, with an equal number of students in each row. How many students stand in each row?
- Give the students time to attempt the problem independently then share their strategies in pairs. You might use Slide Two of PowerPoint 2, or use cubes, to illustrate strategies that students use.
As with measurement division students may use addition and multiplication build up strategies. For example, 6 x 5 = 30 (five students in each team), 6 x 10 = 60 (ten students in each team), 6 x 11 = 66, 6 x 12 = 72, …, 6 x 14 = 84 (14 students in each team)
How might the problem be solved in one operation? (84 ÷ 6 = 14)
Why would you ask yourself, “How many sixes are in 84?”
Look for students to explain that putting one person in each team makes a six. Finding out the number of sixes in 84 tells how many times one person can be allocated to each team. - Use Slide Three of PowerPoint 2 to introduce this problem:
32 students are in Room 8.
The teacher wants to share the students equally into five tug o’ war teams.
How many students will be in each team? - Ask students to attempt the problem in pairs. Look to see that they use the accessible fact, 6 x 5 = 30, to solve the problem. How do they deal with the remainder?
Students might suggest that three teams might have six players and the other two teams have seven players. Agree that equal teams are not possible.
What will the calculator say? - Invite predictions then ask students to key in
32 ÷ 5 = 6.4
What fraction is “point four?” (Students may know that 0.4 equals 2/5 or 4/10) - Use Slide Four of PowerPoint 2, or cubes, to enclose equals sets of six and connect them to the set rings. The remaining two people are two fifths of five, the number needed to give another person to each team.
- Pose another similar problem, such as:
Three working groups are made to weed the school vegetable garden.
There are 47 volunteers to do the work.
If all three gangs are equal, how many volunteers go into each gang? - Discuss strategies to solve the problem and the meaning of a calculator answer:
47 ÷ 3 = 15.66666666
Point six recurring (written as 0.6) equals two thirds, since two people remaining is two thirds of the number of volunteers needed for another single share.
Activity 2
- Ask students to work in pairs to write their own summary of the two kinds of division (measurement and equal sharing). Consider relating their problems to a shared context of learning from another curriculum area (e.g. your problems should be linked to what we have learnt about the Treaty of Waitangi).
Ask them to write a simple number problem for each kind of division, and write a division equation for each problem. As a class, you could develop sentence stems, starters, or guidelines to ensure everyone knows how to start writing their problem.
(NB. This task can be challenging. Focus on the language of sharing/each or number of groups). After an appropriate time, let students roam the room to get ideas from the work of other pairs. - Record a summary on the class chart. Use the words: dividend, divisor and quotient.
Show the meaning of each number and symbol in division equations, like this:
180 (dividend) ÷ 12 (divisor) = 15 (quotient).
= means “is the same quantity as”
÷ means “equally shared among” or “measured in units of” - Ask students to provide an example of a problem where the quotient has a remainder. For example, “22 players are put into teams of four. How many teams can be made?” written as 22 ÷ 4 = 5.5 or 22 ÷ 4 = 5 ½
- Reminded students about the meaning of the fraction in a quotient.
That fraction of the unit, or of a full share, remains.
Session 3
In this session, division as equal sharing is applied to problems with continuous whole, rather than the sets situations used in the previous two sessions. Students come to understand that quotients can sometimes be fractions, the result of division in which ones (wholes) are not sufficiently accurate.
- Use PowerPoint 3 to pose the following problems. These problems could be adapted to reflect a context that is more relevant to your learners (e.g. a tray of pani popo is shared between 3 people, how much does each person get?)
- 1 pizza shared between 3 people. How much does each person get?
Record the equation 1 ÷ 3 = 1/3 and discuss the meaning of the symbols. Note that the equal share is one third of a whole pizza. - 3 pizzas shared between 4 people. How much does each person get? (Slide Three of PowerPoint 3)
Let students create paper pizzas, or drawings, and share the pizzas physically. Some may cut the pizzas into halves first and give one half to each person. If they halve the remaining halves, they get quarters, so each person gets one half and one quarter of a whole pizza. In total each person gets one half and one quarter, or three quarters of a whole pizza. (See Slide Four)
Record a division equation for the operation, with emphasis on the meaning of the ‘divided by (÷)’ symbol as “equally shared among.”
3 ÷ 4 = 3/4 - 5 pizzas shared among two people. How much does each person get? (Slide Five of PowerPoint 3)
Notice that the number of pizzas is greater than the number of shares. That situation produces equal shares greater than one whole pizza, an important generalisation for students to make.
5 ÷ 2 = 5/2 = 2 ½
- 1 pizza shared between 3 people. How much does each person get?
- Slides Five and Six show two different ways to share five pizzas equally among two people. Usually students share out whole pizzas first then divide the remaining pizza among the two people. A generalised way to share equally involves cutting each pizza in half then giving each person one half from each pizza.
- Pose several other sharing problems for students to solve, such as:
- 2 pizzas shared between 5 people. How much does each person get?
- 4 pizzas shared between 3 people. How much does each person get?
- 5 pizzas shared between 8 people. How much does each person get?
- Ask students to work in pairs to create their solutions. Encourage students to draw diagrams and record equations to communicate their ideas. Some students will benefit from physically cutting paper circles to act out each problem. More advanced students could write new problems for their partner, or for other pairs of students.
- As students work, roam the room looking for the following:
- Do students create and correctly name the equal shares, using fractions?
- Do they exhaust all the pizza?
- Do they record division equations to model the situations?
- Do they notice the generalisation that a ÷ b = a/b?
- Gather the class to share solutions. Bring out the points above through discussion. It is particularly important that students recognise the symbolic generalisation. That generalisation is used extensively in algebra and whenever a fraction is converted to a decimal using a calculator, e.g. 3 ÷ 4 = 0.75.
- The Figure It Out series contains the following activity that can be used as independent activity for your students. A PDF is provided for the students to read and teacher notes are included.
Pizza split looks informally at division as non-commutative in a pizza sharing context, i.e., a ÷ b ≠ b ÷ a.
Session Four
- In this session students explore division when the dividend is a mixed number or fraction and the divisor is a whole number. They are encouraged to rename the mixed number as an improper fraction, e.g. 2 ¾ = 11/4. The problems involve sharing (partitive), and measurement (quotative) division.
Use Slide One of PowerPoint 4 to present this sharing (partitive) problem:
Problem dividend divisor quotient I have this much pizza (4½).
I want to share the pizza equally among the three people at my party.
How much pizza should each person get?
- Read the problem together.
What would the division equation for this problem look like? (4 ½ ÷ 3 = [ ])
Why is this problem difficult to solve? - Let students attempt to solve the problem in pairs. Encourage access to paper circles, and diagrams, so students can experiment and verify their answers. Some students may apply their learning from the previous lessons to find 4 ÷ 3 = 1 1/3, then divide the remaining one half among the three people. The result is 1 1/3 + 1/6 which equals 1 ½.
Could we look at the dividend (starting amount of pizza) in a way that makes the problem easier? - Slide Two of PowerPoint 4 shows the renaming of 4 ½ as 9/2. Sharing nine objects among three people is simple. Each person gets three objects.
How could we rewrite our equation? (9/2 ÷ 3 = 3/2)
Note that the dividend is nine halves, so the equal shares are three halves. - Complete the table to list the dividend, divisor, and quotient of the equation.
- Slide Three of PowerPoint 4 shows another problem where the dividend is a mixed number and divisor is a fraction. However, the situation involves measurement division.
I have 4 ½ metres of cloth.
Each bag is made from ¾ of one metre of cloth.
How many bags can I make? - Make strips of paper and scissors available to pairs of students.
Ask them to solve the problem and discuss their solutions with another pair.
Some students may approach it this way: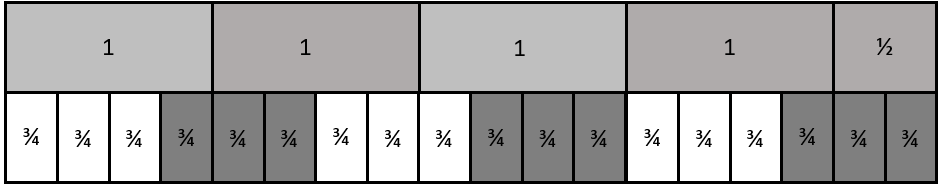
Students may realise that two units of three quarters equal one and one half. There are three units of one and one half in four and one half.
If we rename the divisor into quarters, how does that make the problem easier to solve?
How many quarters are in one? How many quarters are in 4 ½? (Slide Four of PowerPoint 4 shows the renaming of 4 ½ = 18/4.)
If I have 18 quarters, how many bags can I make? Each bag uses 3 quarters.
How can we write the problem as an equation? (18/4 ÷ 3/4 = 6) Record the discussion using the table used in problem one.
Problem dividend divisor quotient I have 4½ metres of cloth.
Each bag is made from ¾ of one metre of cloth.
How many bags can I make?
4 ½
or
18/43/4 6 - Make paper strips, fraction pieces and set collections (e.g. cubes or counters) available to the students. Distribute Copymaster 2, and discuss how to complete the task. Together complete the second example. Have students work in pairs to complete the empty sections, including writing their own fraction word problems.
- Have students pair share and mark answers.
Questions 6 and 7 require students to use the information provided. For example, Question 6 responses must involve 1 ½ ÷ 6 = ¼ . Sharing division provides the easiest contexts, e.g. “Jim has one, and one half hours to wash six cars. What fraction of an hour should he spend on each car?” Measurement division is more complex, “It takes Jim six hours to paint the fence. What fraction of the fence can he paint in one, and one half hours?”
Question 7 requires students to apply inverse thinking to identify the dividend. Since 8 x 2/5 = 16/5 = 3 1/5 the division problem must be 3 1/5 ÷ 2/5 = 8. Problems will probably involve measurement, e.g. “Kaylene has three and one fifth metres of ribbon. It takes two fifths of one metre to tie each bouquet. How many bouquets can Kaylene tie?
Session Five
In this session students explore division where the dividend is a whole number and the divisor is a fraction, e.g. 1 ÷ 2/5 = 5/2 = 2 ½. Fraction strips (See Copymaster 3) are used as the physical representation since length is the simplest attribute for students to use. The problems involve measurement division since a fractional number of shares makes no sense. For example, 1 ÷ 2/5 means “How many quantities of two fifths equal one?”
- Begin with Slide One of PowerPoint 5. You may like to use an online manipulative tool for fraction strips. There are many available.
Jamal cycles two thirds of a kilometre in one minute.
How much time does he take to cycle one kilometre?
Animating the slide allows two thirds to be shown as a unit. Treating a non-unit fraction as a single unit is a major conceptual challenge for students.
Possible answers might be:
“One” (Disregarding the extra part)
“Not quite two” (Accepting the extra part but not being precise)
“One and a bit”
The challenge is to name the ‘bit’ in terms of the divisor of two thirds. There are one and one half lots of two thirds in one. Jamal takes one and one half minutes to ride one kilometre.
What is one and one half as a fraction? (1 ½ = 3/2)
How can the operation be written as an equation? (1 ÷ 2/3 = 3/2) - Use Slide Two of PowerPoint 5.
Arohia cycles two fifths of a kilometre in one minute.
How long does she take to cycle one kilometre?
Students should establish that two, and one half lengths of two fifths make one. Record the equation as:
1 ÷ 2/5 = 5/2 = 2 ½
Why is the answer five halves? (There are five fifths in one, and two fifths are used each time. The answer should be the same as the answer to
5 ÷ 2 = 5/2 = 2 ½ - Use Slide Three of PowerPoint 5.
Mere cycles three eighths of a kilometre in one minute.
How long does she take to cycle one kilometre?
What is this problem as division? 1 ÷ 3/8 = [ ]
What is the answer? 1 ÷ 3/8 = 8 ÷ 3 = 8/3
Mere takes two and two thirds minutes to cycle one kilometre. - Use Slide Four to show the answers so far.
Is there a pattern?
Students should notice the reciprocal (upside down) relationship between the divisor and the quotient.
For example, the numerator of 3 in the divisor results in a denominator of 3 in the quotient, and the denominator of 8 results in a numerator of 8 in the quotient.
1 ÷ 3/8 = 8 ÷ 3 = 8/3 - Provide the students with Copymaster 4 to work from in pairs. Students may need access to fraction strips in physical, or online virtual form, to solve the problems.
- Roam the room as students work. Look for the following:
- Do your students identify the divisor as a unit of measurement?
- Can they draw an appropriate strip diagram to model each problem?
- Are they able to express the number of times the unit fits into one (whole) using fractions?
- Do they apply the generalisation that 1 ÷ a/b = b/a ?
- Bring the class together to share solutions. Interesting points to raise are:
- Question Six:
The diagram looks like this: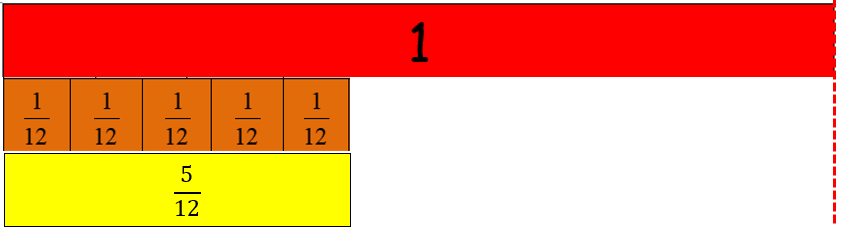
How can we figure out how many times a unit of five twelfths fits into one? (12 ÷ 5 = 12/5) - Questions Five and Seven:
These are inverse problems, that is 1 ÷ a/b = 7/3 and 1 ÷ a/b = 5/2 though the algebra is not necessary.
Connect these problems to whole number division, e.g. 15 ÷ [ ] = 5. To solve the whole number problem students might choose [ ] x 5 = 15 or 15 ÷ 5 = [ ]. So, 1 ÷ 7/3 = 3/7 gives the answer to Question Five and 1 ÷ 5/2 = 2/5 gives the answer to Question Seven.
- Question Six:
- You may like to finish the unit by asking students to create a poster or a journal entry about the connection between division and fractions. You might create a class poster for display in the mathematics area of your classroom.
Dear parents and whānau,
We have been exploring the connection between division and fractions in class.
You might enjoy solving these two problems together to see what they have been learning.
Problem One: Four people equally share three doughnuts. How much of one doughnut does each person get?
Problem Two: If each person needs three eighths of a big pizza, how many people can be fed with one and one half pizzas?