Late level 3 plan (term 1)

Planning notes
This plan is a starting point for planning a mathematics and statistics teaching programme for a term. The resources listed cover about 50% of your teaching time. Further resources need to be added to meet the specific learning needs of your class, to support your local curriculum and to provide sufficient teaching for a full term.
Resource logo
Level Three
Integrated
Units of Work
This unit seeks to connect learning outcomes, and provide problem solving opportunities across all five content strands, number, geometry, statistics, algebra, and measurement. The context of houses is used to develop concepts such as drawing and modelling 3-dimensional objects, using coordinate...
  • Draw a diagram showing the top, side, front, and back of a solid figure.
  • Make the net for a solid figure.
  • Use coordinates on a map to identify the position of houses.
  • Construct triangles and quadrilaterals by measuring appropriate lengths
  • Identify the properties of triangles and quadrilaterals.
  • Find all...
Resource logo
Level Three
Number and Algebra
Units of Work
This unit builds students’ understanding of place value, extending to 6 digit whole numbers.
  • Understand the structure of 6 digit whole numbers.
  • Read and write six digit whole numbers.
  • Represent numbers up to 999 999 using place value equipment
Resource logo
Level Three
Geometry and Measurement
Units of Work
In this unit students use street maps as the context to learn about coordinates and grid references, and for giving and following instructions involving directions and distances.
  • Find and describe the location of an object using coordinates and grid references.
  • Follow and give directions involving turns (left and right), compass directions (N, S, E, W).
  • Follow and give instructions involving distances by interpreting simple scales
Resource logo
Level Three
Number and Algebra
This unit of work investigates how relational thinking is applied to multiplication and division.
  • Use relational thinking as a basis for a range of number strategies.
  • Explain number strategies using materials and diagrams.
Resource logo
Level Three
Statistics
Units of Work
In this unit we investigate the amount of water contained in a carrot and we use a time series graph to plot the "weight" of the carrot as the water in the carrot evaporates. The students also pose their own carrot investigative questions.
  • Plan a statistical investigation using the PPDAC cycle.
  • Choose an appropriate data display (bar graph, dot plot, time series graph).
  • Make statements about the findings of the investigation.
Resource logo
Level Three
Statistics
Units of Work
In this unit, using our fridge as the context, we collect and present data using dot plots and bar graphs. We start to learn about using the computer to display our data and explore features of data display.
  • Plan a statistical investigation.
  • Display data in dot plots, strip graphs and bar charts.
  • Discuss features of data display using middle, spread, and outliers.
Source URL: https://nzmaths.co.nz/user/75803/planning-space/late-level-3-plan-term-1

Houses

Purpose

This unit seeks to connect learning outcomes, and provide problem solving opportunities across all five content strands, number, geometry, statistics, algebra, and measurement.  The context of houses is used to develop concepts such as drawing and modelling 3-dimensional objects, using coordinate systems to locate position, find the possibilities of events, and identify paths through simple networks.  

Specific Learning Outcomes
  • Draw a diagram showing the top, side, front, and back of a solid figure.
  • Make the net for a solid figure.
  • Use coordinates on a map to identify the position of houses.
  • Construct triangles and quadrilaterals by measuring appropriate lengths
  • Identify the properties of triangles and quadrilaterals.
  • Find all the possible outcomes for a simple event.
  • Find a path through a network.
Description of Mathematics

This multiple-strand unit covers a wide range of mathematics topics including: properties of triangles and quadrilaterals, networks, nets and diagrams of 3-dimensional solids, coordinates on a number plane, and combinations. Students need to have knowledge of 3D shapes (e.g. cuboids), 2D shapes (e.g. triangles) and of how to read coordinate pairings.

It supports students who are working within stage 6 (advanced additive) of the Number Framework.  At stage 6 a student can estimate answers and solve addition and subtraction tasks involving whole numbers by choosing appropriately from a broad range of strategies (for example place value partitioning, rounding and compensating or reversibility). The student uses a combination of known facts and a limited range of strategies to derive answers to multiplication and division problems (for example doubling, rounding or reversibility). 

Opportunities for Adaptation and Differentiation

This unit can be differentiated by varying the scaffolding provided to make the learning opportunities accessible to a range of learners. For example, drawing views of 3-dimensional structures can be scaffolded using variables like:

  • simplifying the complexity of the building
  • allowing students to physically move and manipulate the position of a building when drawing it
  • removing the requirement of scale
  • providing grid paper so drawing to scale is easier.

The practical nature of the tasks in the unit requires access to physical and diagrammatic resources. Providing materials, and putting varied demands on what tasks are carried out mentally, is a powerful tool in catering for diversity.

The contexts in this unit can be adapted to reflect the cultural and geographical diversity of your class and environment. For example, historic home tours might be connected to tours of local important buildings (e.g. the buried village outside Rotorua, or the Waimunga Valley pathways, the Dunedin railway station). Constructing nets for solids might be framed around models of wharenui or wharekai, or of significant buildings in the local area.

Te reo Māori vocabulary terms such as inea (to measure), tapawhā (quadrilateral), tapatoru (triangle), taunga tukutuku (coordinates), and tūponotanga (probability, chance) could be introduced in this unit and used throughout other mathematical learning.

Required Resource Materials
Activity

Session 1

  1. Show the students House Plan One (Copymaster 1).  Illustrate how the house designer drew the plans by setting up an object on a desktop and drawing the object as seen from the front, side, and top as you move around the object. Provide the students with plasticine or modelling clay and ask them to make a small model of the house that is shown in these plan drawings. To engage students further in this learning, you might ask architects, planners or builders, who are members of your school community, to come in and discuss how they use house plans and nets in their work.
  2. Next, support students to check their models by sketching it. They should move the model around to be able to see the front, side, and top views.  The drawings can be checked against the original plans. Discuss with the students what features they concentrated on in producing the model.  This might include thinking of the model in two parts - the basic cuboid (rectangular prism) and the triangular prism that forms the roofline.
  3. Provide the students with House Plan Two, from Copymaster 1, and challenge them to make a 3D model of that house using the provided clay or other modeling materials..  Help scaffold the task by discussing what features of the house are different to the previous plan.  Students may note that the new house has the same roofline but the top view shows that it is L-shaped.  As with the first plan the models can be checked by using them to produce plan drawings.
  4. The activity can be extended in two ways.  Firstly tell the students that architects frequently make models of their buildings for presentation purposes.  Get them to design the net (flat pattern) that could be folded up to make a model of house one.  This could be produced using the plasticine model by rolling it on a sheet of paper and tracing around each face as it lies against the paper until all the faces have been traced.  Students should note that use of symmetry can make the process much easier.
  5. One net of house plan one looks like this:
    A net of a house plan.
  6. Discuss with the students how nets usually have tabs to allow them to be glued together.  The usual convention is to put a tab on every second edge as you work around the perimeter (outside) of the net but other ways are also workable.  Encourage students to experiment with different ways of creating tabs, and discuss the advantages and disadvantages of different methods. Creating the net for House Plan Two is considerably more difficult but can be done in halves and symmetry used to create the full net. 
  7. Another extension of the activity is for students to make their own house model from plasticine and create front, side and top view drawings of it.  These drawings are then given to another student who must produce either the model or net for the plan. This could be extended to making building models of important buildings from your local context (e.g. the school buildings, the local marae)

Session 2

The context of this session involves discussion of the distance different students live from school. If you feel this context is not appropriate for your class, you could reframe the learning in the context of planning a school trip. You could choose three different places for the class to “visit” on this hypothetical class trip (e.g. the museum, the swimming pool, the marae). Finding the middle point of these locations could be presented as finding the best location for a lunch stop. In a historical context, the three places could be chosen from places where the Treaty of Waitangi was signed (e.g. Waitangi, Manukau, Opotiki, Akaroa,​​ Ōnuku, Ruapuke Island).

  1. Ask several students in the class how far they live away from the school. They may give their answers in distance or travel time. Comment that they are going to investigate where the school should be to make it as central as possible. Ask two students to mark as accurately as possible where their house is on a street map of the area. Ask the students if the school is central (in the middle) of these two houses. This is easy to visualise by drawing a line between the two locations:

    Diagram of a line drawn between Sarah's house and Ian's house, with the school in the central location between them.

  2. Finding the central location becomes more difficult when three houses are involved. Tell the students to draw a triangle in their books and assume that each corner is the location of someone’s house.  The triangle does not need to be equilaterial. In fact, it is desirable that the students try several different triangles. Challenge the students to find a method of locating the central point for the school, meaning the point that minimises the travel of all three students.
    Triangular diagram of the location of three houses, each at one corner of the triangle.
  3. Discuss the methods that students have used.  These might be focused on features of the triangle, particularly equally splitting angles and sides.  Such methods might produce solutions like:

    Split the angles method.
    Diagram showing the 'splitting the angles' method of finding the central location of a triangle.

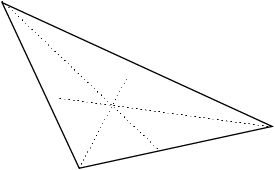
    Split the sides method that, in this case, does not appear to give a sensible solution.
    Diagram showing the 'splitting the sides' method of finding the central location of a triangle, which does not give a sensible solution.

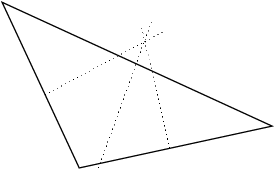
    Width by height method.  Draw the smallest rectangle that includes all of the corners and cut the sides in half.  The intersection of these “bisectors” gives the centre.
    Diagram of the 'width by height' method of finding the central location of a triangle.

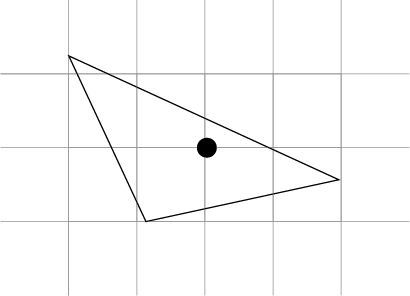
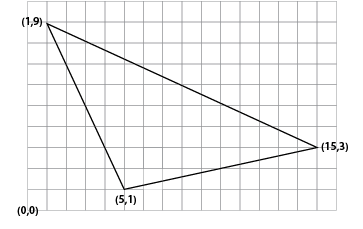
    The co-ordinate method.  Each house location is given an ordered pair and the average of the x-coordinates and the average of the y-coordinates is found.  This gives the centroid or balance point of the triangle.
    Diagram of the 'co-ordinate' method of finding the central location of a triangle.
    The average of the coordinates gives the point (7, 4.33…). In this case the coordinate averaging method seems to give a good indication of the centre.

  4. Discuss with the students which of these methods will also work if we consider finding the centre of four or more houses. They may conclude that the length by width and coordinate methods will always work, no matter the number of houses. The split the angles and sides methods could be tried with some quadrilaterals to determine if they will work.

    Diagram showing the split the angles and sides methods with some quadrilaterals to determine if they will work.

  5. Apply both the length by width and coordinate methods to the task of finding the central location for a school that only included students in your class. Use a scale map of the district. Draw a coordinate plane over the map and ask each student to provide the location of their house as an ordered pair. Note that decimal ordered pairs could be used to make the locations more accurate. A spread sheet might be used to find the average of all the coordinates quickly.

Name

X coordinate

Y coordinate

Joe

3.5

6.4

Gill

0.9

8.7

Shirley

6.5

1.2


=average(B2:B?)

=average(C2:C?)

  1. Compare the centre as determined by both methods. Discuss which method appears to be the most accurate. Students may note that outlier (extreme) coordinates have a pronounced effect on the length by width method but minimal effect on the average coordinate method. This could be modelled by introducing a hypothetical student who lives an extreme distance from the school and noting the effect using the spreadsheet and map.

Session 3

  1. Tell the students that they are going to investigate the best way to build framing on the wall of a house. This could be related to the context of new school buildings, building a dream classroom, or the building of local community places (e.g. the marae). Using cardboard strips and split pin paper fasteners, get the students to construct the following “walls.”
    Diagram of some wall models built using cardboard strips and split pin paper fasteners.
  2. Point out the need to accurately measure the strips and location of the holes so that the walls lie flat. Which one is more stable if it is placed standing up on a flat surface? Encourage students to estimate their answers to this, and justify their thinking. The walls of the house need to be reasonably rigid. The students should notice that the vertical and horizontal arrangement tilts while the triangular arrangement stays fixed.
    Diagram showing how the vertical and horizontal arrangement tilts.
  3. Ask the students why they think this occurs. They may comment that triangles are strong while the angles of the rectangles are movable (which can be demonstrated by tilting the rectangular model). Discuss why the triangular walls, while very strong, might not be functional in building houses. Building triangular houses constricts the amount of space available inside of the house. This relates to the difficulty of measuring angles, so that the walls will intersect, and the difficulties of living in dwellings with non-perpendicular (right-angled) corners. A-framed houses are a good example of the later problem. Building a tetrahedron (i.e. triangular pyramid) with polygons or toothpicks and blu-tack might be a good way to demonstrate the inefficiency of space usage.
  4. To develop students’ ideas about the structural strength of triangles and quadrilaterals get them to carry out the following investigation. 
  5. Make the following lengths from cardboard strips.  The lengths show the length between the holes:
    Diagram of three cardboard strips, showing lengths between holes.
  6. Ask the students to make as many different triangles as they can by fastening the cardboard strips with fasteners and moving the sides around.  They will realise that only one triangular shape is possible as the side lengths determine the angles at the corners.
  7. Ask them to use another length of cardboard strip (for example 18cm between holes) and use it with the other lengths to make quadrilaterals of different shapes.  The students will see that the angles at the corners can be changed by tilting the quadrilateral.  This could be used at another time to investigate the sum of interior angles.
  8. The students might try making triangles and quadrilaterals with different lengths to further validate their conjectures if need be.
  9. Extend this idea by telling the students that they are allowed to add only one strip of card and fasten it to the original vertical and horizontal wall arrangement they started with.  The challenge is to stabilise the wall so it does not tilt.  This can be done by using a brace that effectively turns the quadrilaterals in the wall into triangles with rigid structural strength.
    Diagram showing a diagonal brace added to the vertical and horizontal arrangement.

Session 4

  1. Tell the students that they have been hired by a construction company as a consultant to look at the colour schemes for a new housing estate (Copymaster 2).  The houses all have the same design so the company is keen to use the colours to make each house appear different to the others in the estate. This could be related to new buildings that are being constructed in your local area. It could also be related to pre-existing buildings (e.g. the school, the marae), or imaginary buildings (e.g. a dream school). In a historical context, this learning could be related to the types of materials that were used to build early houses in New Zealand (e.g. kauri, rimu, mataī).
  2. The company has only bought three colours of paint: red, blue and yellow. They have decided that for each house the roof will be painted in one colour, the walls in a different colour, and the window sashes and door in a third colour. They are wondering if three colours are enough. How many houses can be painted with three colours remembering that each scheme must be unique? That is, no two houses can look the same. Encourage the students to be systematic in planning the colour schemes. Provide them with copies of Copymaster 2.
  3. After an appropriate time of investigation, bring the students together to share their ideas. Focus on strategies they have used to systematically find all the possibilities. Strategies might include:

Using tables

RoofWallsDoor/Windows
RedYellowBlue
RedBlueYellow
YellowRedBlue
YellowBlueRed
BlueYellowRed
BlueRedYellow

Using tree diagrams

                  Roof                             Walls                Door/Windows

Tree diagram showing all possibilities for combinations of roof, walls, and door colours.

Focusing on the structure of these models reveals that the six combinations are found by finding three possibilities for the roof colour multiplied by two possibilities for the walls (that is 3 x 2 x 1).

  1. The company has built 120 houses in the estate so obviously three colours are not sufficient to make each colour scheme unique. Ask the students to predict how many colours will be needed to produce 120 unique colour schemes. Intuitively it seems that a large number of colours will be required.
  2. Suggest to the students that they progress systematically in finding out the number of combinations when each new colour is added. This should involve “adding on” to the tables, diagrams, or other models that they used in the simpler example with three colours.
  3. The students may notice that the addition of a fourth colour, say green, results in a four fold increase in the number of possibilities. Extending the table illustrates this clearly:
RoofWallsDoor/Windows
RedYellowBlue
  Green
RedBlueYellow
  Green
RedGreenBlue
  Yellow
YellowRedBlue
  Green
YellowBlueRed
  Green
YellowGreenRed
  Blue
BlueYellowRed
  Green
BlueRedYellow
  Green
BlueGreenRed
  Yellow
GreenRedYellow
  Blue
GreenYellowRed
  Blue
GreenBlueRed
  Yellow

Similarly drawing the tree diagram will reveal four possibilities for the roof colour multiplied by three possibilities for the wall colour multiplied by two possibilities for the door/windows colour (4 x 3 x 2 = 24).

  1. Students will have to look for some generalisation in determining how many possibilities occur with five colours. Creating all of these possibilities would be a painstaking process. Ask the students to discuss in groups what might happen when the fifth colour is used. Look for reasoning like:
    Roof                             Walls                            Door/Windows
    5 colours          x          4 colours left     x          3 colours left    gives 60 possibilities.
  2. This would mean that a sixth colour would create 6 x 5 x 4 = 120 possible colour schemes which would be enough to make each of the 120 houses unique.
  3. Students might explore other scenarios that are either simpler or more complex. For example:
    What happens to the number of possibilities if it is decided that the roof, windows, and doors are painted the same colour?
    What happens to the number of possibilities if the windows and door are painted in different colours?
  4. Students might also be asked to solve problems that are similar in structure. For example:
    You have these digit cards in a pack: 0, 1, 2, 4.  You deal out three cards.  4 then 2 then 0 come up. 
    What other card combinations might have come up?
    How many different combinations are there?

Session 5

  1. Discuss with the students why people might be interested in very old houses. Tell them that touring large, old houses is very popular with tourists. As the houses are very precious it is important to design tours that do not involve returning frequently to the same room or doorway. Tourists don’t like repeating themselves either.
  2. Use an overhead projector to show the plan of the rooms in "Comfy Cottage" (Copymaster 3). The gaps indicate doorways and the start and finish indicate where the tour is to begin and end. Tell the students to mark a tour through Comfy Cottage. Note that there are several possible tours. One possible tour is given on Copymaster 3. Discuss strengths and limitations of the tours. The example given returns to the lounge.
    Is it possible to tour the whole house without returning to the lounge?
  3. Tell the students that they are going to be given several historic homes to design tours for. They will need to decide which rooms to start and end the tour on and check to see whether the tour will go through each doorway only once. Provide the students with copies of Copymaster 4 and encourage them to work in pairs in solving the tour problems. At this stage, you might revisit learning around local buildings of significance, by incorporating floor plans of these buildings. These plans could also be used to extend more knowledgeable students.
  4. After an appropriate time, bring the class together to share solutions. Concentrate firstly on how the students identified which rooms to begin and end the tour at. Look for common features of these rooms. Students might notice that these rooms always have either one or three doorways. Discuss what they notice about the rooms that are passed through. Focus on the number of doorways in these rooms.  Students may notice that they have either two or four doorways.
  5. Look at both scenarios, an odd or even number of doorways. For a room with an even number of doorways a tourist can either start inside or outside it.
    Diagram showing tour designs for a room with an even number of doorways.
    If a tourist starts inside the room they must return to it.
    If a tourist starts outside the room they must end up leaving it.

    For a room with an odd number of doorways the opposite scenario is true.
    Diagram showing tour designs for a room with an odd number of doorways.
    If a tourist starts inside the room they can return to it many times but always end up leaving it.
    If a tourist starts outside the room they can pass through it several times but will always end up returning to it.
  6. In this analysis it is easy to see that any house cannot have more than two odd doorway rooms if the tour is to work. This means that the tour must start in one odd room and end in the other. Along the way, any even-doored rooms are entered then left.
  7. Challenge the students to try this theory out by creating two house plans where a tour is possible and two plans where a tour is not. Students can share these plans to help confirm that a tour is only possible given no more than two odd-doored rooms.
Attachments
houses-1.pdf277.77 KB
houses-2.pdf187.7 KB
houses-3.pdf195.6 KB
houses-4.pdf192.29 KB

Place value with whole numbers

Purpose

This unit builds students’ understanding of place value, extending to 6 digit whole numbers.

Achievement Objectives
NA3-3: Know counting sequences for whole numbers.
Specific Learning Outcomes
  • Understand the structure of 6 digit whole numbers.
  • Read and write six digit whole numbers.
  • Represent numbers up to 999 999 using place value equipment
Description of Mathematics

Understanding place value is crucial if students are to develop the estimation and calculation skills necessary to become numerate adults. Our number system is based on groupings of ten. Ten ones form one ten, ten tens form one hundred, ten hundreds form one thousand, and so on. The system continues, giving us the capacity to represent very large quantities. The Place values such as one, ten, one hundred, one thousand are powers of ten. That means that the place immediately to the left of a given place represents units that are ten times more than the given place, e.g. thousands are ten times greater than hundreds.

Ten digits, 0, 1, 2, 3, 4, 5, 6, 7, 8, and 9 are used to represent all the numbers in a base ten number system. A new number is not needed to represent ten, because it can be thought of as one group of ten. Similarly, when one is added to 999, we write 1000. Therefore, we do not need a separate number symbol for one thousand. The position of the 1 in 1000 tells us about the value it represents. Zero has two uses in the number system, as the number for ‘none of something’, e.g. 6 + 0 (i.e. none of something) = 6, and as a placeholder, e.g. 7040. A number is a placeholder when it occupies a place, or several places. This allows for communication of the values represented by other digits. For example, in 7040 zero acts as a place holder in the hundreds and tens places. In turn, this communicated the value of the 7 and 4 digits.

Place value means that both the position of a digit, as well as the value of that digit, indicate what quantity it represents. In the number 2753, the position of the 7 is in the hundreds column, meaning it represents seven hundred. 2 is in the thousands column which means that it represents two units of one thousand, called 2000.

Understanding the nested nature of place value is necessary for students to operate on whole numbers and decimals. Nested means that the places are connected, e.g. within hundreds there are tens, within ones there are tenths. Renaming a number flexibly is an important application of nested place value.

In particular, it is vital that students understand that when ten ones are combined they form a unit of ten, when ten tens are combined they form a unit of one hundred, and when ten hundreds are combined they form a unit of one thousand. For example, the answer to 2610 + 4390 is 7 thousands since 610 and 390 combine to form another thousand. Similarly, when a unit of one thousand is ‘decomposed’ into ten hundreds, the number looks different but still represents the same quantity. For example, 4200 can be viewed as 4 thousands, and 2 hundreds, or 3 thousands and 12 hundreds, or 2 thousands and 22 hundreds, etc. Decomposing is used in subtraction problems such as 7200 – 4800 = □ where it is helpful to view 7200 as 6 thousands and 12 hundreds.

At Level 3 students need to develop a multiplicative view of place value that includes understanding the relative size of quantities represented by different numbers. A nested view of 230 as 23 tens allows multiplicative connection between 23 and 230. 230 is ten times larger than 23, and 23 is ten times smaller than 230. Such knowledge can be expressed with equations, 23 x 10 = 230, 10 x 23 = 230, 230 ÷ 10 = 23. Multiplication and division basic facts can be leveraged for harder calculations, 4 x 3 = 12 so 4 x 30 = 120 (ten times more). 30 x 4 = 120 as well. 12 ÷ 3 = 4 so 120 ÷ 30 = 4.

Opportunities for Adaptation and Differentiation

The learning activities in this unit can be differentiated by varying the scaffolding provided or altering the difficulty of the tasks to make the learning opportunities accessible to a range of learners. Ways to support students include:

  • reducing the number of digits students are working with
  • providing open access to a variety of materials for representing numbers (arrow cards, Multibase Arithmetic Blocks, place value houses)
  • using a variety of physical and digital materials to model the construction, addition, and decomposition of numbers
  • using the digital learning object Modelling Numbers: 6-digit numbers to provide support with reading and writing numbers
  • creating flexible groups (mahi tahi model) so that students can support each other, share their thinking and model ideas for each other.

This unit is focussed on the place value structure of whole numbers and as such is not set in a real world context. Learning to read and write numbers in Māori or other Pacific languages will support students’ developing understandings, because number names are derived from their place value structure in these languages. Numbers in te reo Māori can be used throughout this unit.

Required Resource Materials
Activity

The activities in this unit could be taught in succession over a number of days to provide a concentrated focus on building place value knowledge. Alternatively, selected activities could be used to support place value understanding while students are working on solving number problems.

Activity 1

  1. Begin by distributing a set of 8 place value variation cards (Copymaster 1) to pairs of students. Have them order their set of 4-digit numbers from largest to smallest, laying them out in front of them. Consider starting with smaller numbers (e.g. 2 or 3-digit) if this is appropriate to the needs of your students. 
  2. Once the sets are ordered, have the students rotate in pairs to an adjacent display of ordered cards and check whether these are ordered correctly.
  3. Ask the students to explain what they had to think about as they ordered their cards. Record their place value ideas on a class chart.
  4. Distribute sets of arrow cards to the student pairs and have them make one of the numbers in their set:
    A set of 4 arrow cards showing 1000. A set of 2 arrow cards showing 60. One arrow card showing the digit 5.(1065). 
    Have them discuss the zero in the number. Then ask them to remove or ‘zap’ another digit in their number and record the value of the digit they are removing. For example: the 6 in the number 1065 is removed. In doing so 60 is being removed or subtracted from the number. This is clearly shown by using arrow cards.
    Ask what they noticed when the 6 (60) was removed. (A zero appeared in its place).
    Discuss zero as a placeholder. Zero adds no value to the number, but has the important job of holding a place. Have the students make another of the 4-digit numbers and repeat this.

Activity 2

  1. Make MAB materials available to the students.
    Have them play Fish for 1000 (Copymaster 2) in pairs or groups of four to consolidate their understanding of the composition of 4-digit numbers.
    Students can model the numbers with materials as needed, to support their understanding. They can also relate these to numbers in their own culture.
  2. Discuss the fact that numbers can be composed (and decomposed) in different ways.

Activity 3

  1. Show the students 1,000 dots (Copymaster 3). Have students tell you what they see and record all of their ideas using words and numerals. For example: ten groups of one hundred, 1000, 10 x 100, one hundred groups of ten, 1000, 100 x 10. Recording these in other languages that are relevant to your learners (e.g. te reo Māori) will increase engagement in this task. 
  2. Ask the students to explain to a buddy what 10 thousand would look like. Listen to their predictions. Have students attempt to draw this. Show the 10 000 dots image and ask if this is ten thousand. Repeat step 1 above.
    Point out that when we write the number 1000 there is no space after the 1 and before the three zeros, whilst with 10 000 a space is used to separate the ten from the three zeros. Highlight the fact that 10 thousand is ten times bigger, by highlighting one row (1000) and then counting the rows.
  3. Write 100 000 on the class chart. Have the students describe what 100 000 might look like. Listen for and record their ideas (ten times bigger). Show one hundred thousand and repeat step 1 above. Again, point out how the number is written with the space between the 100 and the 000.
    Ask the students to explain why.
  4. Write a 6-digit number on the class place value houses. Have students read it together, referring to the hundreds, tens and ones headings in each of the houses. Repeat with several 6-digit numbers including several examples with zeros as placeholders. Highlight the hundreds, tens and ones structure of both houses and how this helps when reading bigger numbers.

Activity 4

  1. Make sets of Copymaster 3 with 9 copies of each representation (9 ones, 9 tens, 9 hundreds, 9 thousands, 9 ten thousands and 9 one hundred thousands.) Have sufficient sets for students to have 1 set for each pair.
  2. Distribute Trendsetter and Thousands place value houses, and dot sets to each pair of students. Emphasise that the number of dots is ten times more each time the number has an extra zero and as it shifts one more place to the left.
  3. Have them take turns writing a number with up to 6 digits in the place value house and having their partner read and make the number using the dot materials. Emphasise that it is the number of the dots that is important, not the size of the dots.

Activity 5

  1. Show students the learning object Modelling Numbers: 6-digit numbers, or another similar digital model. Explain that it provides a model for representing numbers using place value equipment. Clicking on the arrow above a place adds one unit in that place to the model of the number, and clicking on the arrow below a place removes one unit from that place in the model.
  2. Make the numbers 6, 7, 8, 9 and 10 (by clicking on the arrow above the ones place to add “one” at a time). Zoom in using the magnifying icon so students can see what is happening. Ask the students what they think will happen when you add another “one” (to make 11), then make the number and watch what happens. Ask the students what they think will happen if you count backwards 11, 10, 9. Then watch the place value equipment change as you remove one at a time using the arrow below the ones place. Repeat this by zooming out and using the same procedure with the thousands, ten thousands and hundred thousands. Support students to understand that the hundreds, tens and ones structure is repeated, and to appreciate that a new place is needed to show more than 9 in any particular place. Note that clicking the right arrow at the bottom of the screen will show different representations of the number: using place value houses, in standard form or represented on a three bar abacus.
  3. Have students work in pairs to model numbers on the learning object. They can click the die at the bottom left of the screen and a number will appear in words for the student to build using the place value equipment. They can click on the question mark symbol to check to see whether their model is correct. Integrate numbers spoken in other languages that are relevant to your students (e.g. te reo Māori) to enhance engagement in this learning.
  4. Have students work in pairs to explore making their own number, saying it aloud and then checking whether they are reading the number correctly using the speaker icon.

Activity 6

Introduce the game 11,111 (Copymaster 4) and support students to play this game in small groups (i.e. 2-4 students).

Street Maps

Purpose

In this unit students use street maps as the context to learn about coordinates and grid references, and for giving and following instructions involving directions and distances.

Achievement Objectives
GM3-5: Use a co-ordinate system or the language of direction and distance to specify locations and describe paths.
Specific Learning Outcomes
  • Find and describe the location of an object using coordinates and grid references.
  • Follow and give directions involving turns (left and right), compass directions (N, S, E, W).
  • Follow and give instructions involving distances by interpreting simple scales
Description of Mathematics

In this unit students are introduced to two ways in which location is represented in real life situations, grid references and coordinates. In both cases the representation is an ordered pair, e.g. F4 as a grid reference, and (6,4) as a pair of coordinates. The convention is to state the horizontal reference (located on the x-axis) first, and the vertical reference (located on the y-axis) second.

Two different grid systems.

In the grid system (left image), a grid reference (F, 4) is used to locate the person in an area. Grid references are frequently used on maps. In the coordinate system (right image) the location of the person is a specific point at the intersection of the lines. The coordinate (6,4) can also be interpreted as a vector from the origin (0, 0). The vector is the combined effect of a shift of 6 units in the horizontal direction, and 4 units in the vertical direction.

Opportunities for Adaptation and Differentiation

The learning opportunities in this unit can be differentiated by providing or removing support to students, by varying the task requirements. Ways to support students include:

  • physically acting out locations, and how to represent them, on a large-scale grid or coordinate plane
  • directing students to use technology, such as Google Maps and Scratch, to experiment with representing locations, and checking to see if the coordinates are correct
  • explicitly modelling use of the two systems of representations (grid and coordinate)
  • discussing the similarities and differences between the two systems
  • providing a wide range of hard-copy and digital maps for students to explore.

Tasks can be varied in many ways including:

  • limiting the complexity of the grid or coordinate plane until the conventions of grid references and coordinates are established
  • encouraging students to work collaboratively, and to check each other’s work
  • using maps of locations that are familiar in the first instance, then using unknown locations to help students appreciate the significance of the representations for navigation
  • provide extra practice and scaffolding for students who need support.

The contexts for this unit can be adapted to suit the interests and cultural backgrounds of your students. Using locations that are familiar and of high interest to students will support motivation. The advantage of familiar locations is that students can use their personal knowledge to validate their work. Students often view non-familiar locations through the media. For example, Great Race events are a hobby for some people, and are readily available on television. Students will enjoy a virtual Great Race through an unfamiliar part of Aotearoa. Choose locations that students show interest in, and/or hold particular cultural significance, e.g. world heritage sites that UNESCO has recognised because of the natural or cultural value. This unit offers opportunities for authentic links to be made to procedural writing.

Te reo Māori vocabulary terms such as mahere (map), ahu (direction), and huri (turn) could be introduced in this unit and used throughout other mathematical learning.

Required Resource Materials
Activity

Session 1

  1. Give the students a copy of a street map of the area around the school. The map might be obtained by screen grabbing a Google Map view of the area. Ensure that you capture the scale as well. Draw a grid system on the map before you photocopy it (See Copymaster 1). Use an interactive whiteboard, screen or projector to display the map.
  2. Help the students to orientate themselves with the map by asking them to locate some local features. Choose places of particular significance to your students. For example, ask the students:
    Where is the school on the map?
    Where is the local park/sports ground?
    Where is a local shop (dairy, petrol station, bakery, church etc)?
    Where is your house?
  3. Ask the students to describe the locations of the school, sports field, shop, house. Students may describe the location using street names (the dairy is on Somerville Street), other local features (the church is beside the Bushlands Park), or with directional language (e.g. north, to the left). Explain to the students that grid references are a useful way to describe locations on a map because they define what part of the map the place is in.
  4. Choose several examples of places on the map.
  5. Show the students Copymaster 1 as an introductory activity to using grid references.
    How would you tell someone else where The Mole and Chicken Restaurant is located? (B3)
    Where is the Taupo Hospital? (E2)
    What landmark is in the grid G5 (Parts and Service)?
  6. Ask students to work with a partner using Copymaster 1. Tell them to create eight new landmarks on the map, e.g. a dairy, a service station, a pre-school centre, a marae and Tom’s house. Ask them to make up 8 problems for another group about locating one of the landmarks. For example, What landmark is at D4? In what grid would you find Tom’s House?
  7. Ask groups to exchange Copymasters and solve the problems that the other group has set. Compare and self-correct the answers.
  8. Return to the local map on the interactive whiteboard. Suppose you were asked to create an index for your local area. The index shows the location of important landmarks. Ask your students to help by specifying four landmarks and identifying the grid reference for each landmark. Students need to record the references.
  9. Share the grid references by beginning the compilation of an index in alphabetical order.
  10. Show students an index page from an old map book which uses co-ordinate grid references. Some maps are more specific M12 NW means the location is in the northwest sector of the M12 grid.
  11. Discuss: Paper maps are not used much these days. Why would that be?
    Mobile phone technology has made maps redundant and almost removed the need for navigational tools as well. When have you needed to use a map?
    Can you imagine a place where a map might still be useful?
  12. Remote locations often do not have GPS (Global Positioning System) signals so a paper or digital map is an important safety tool. You might look up a news story about lost and found trampers, and locate the place the trampers went missing using Google Maps.

Session 2

  1. Give the students a copy of the local street map from Session One. Imagine that a friend from school is coming to stay. You need to give them instructions about how to get from school to your house. Let’s imagine you live at (address, e.g. 45 Willberry Street).
  2. Use Google Maps to locate the address and get directions from the school. 
    What instructions might we give them?
    Instructions must include turns (right and left), distances and important things to look for (Street names, buildings, parks, etc.)
  3. Ask: How can we find distances on the maps?
    Students may know about the scale.
  4. Take a strip of paper and place it under the scale on the map shown on the interactive whiteboard. Mark a distance from the scale onto the strip, e.g. 200 metres. 
    This distance on the strip equals 200 metres in real space. Let’s tell our friend how far they need to walk along (Street name). Align the strip with the street beginning at the place where the friend starts walking. For example, “They will need to walk about 300 metres up Taharepa Road.”
    This shows a map of a local area. A paper strip has been used to indicate a distance of 300m.
  5. Discuss how parts of the scale will need to be calculated to get an accurate measure. Finding fractions of the scale to get more reference marks is an excellent way to apply fractions as operators, e.g. ¾ of 200.
  6. Ask students to develop a set of clear instructions for their friend to walk from school to your home. Support students who have difficulty with transactional writing by introducing iconic symbols, as would appear on a navigation app for mobile phones.
  7. After completing a set of instructions students can trial the instructions with a partner. The partner follows the instructions exactly as recorded to see if the result matches the intended destination. Turns on maps are particularly challenging, and strategies to complete turns should be discussed. A right turn is relative to the direction of travel so the navigator needs to orientate themselves to that direction before making the turn.

Session 3

  1. Grid references are one way to represent a location. A3, for example, represents an area on a map so the location is not precise. That lack of precision can be problematic when an exact position is needed, e.g. courier delivery, parachute drop, police or military operation. Coordinates provide a precise location and are more associated with other ideas in mathematics than grid references.
  2. Show the students Copymaster 2 on the overhead projector.
    What differences can you see between our grid map and this map?
    Do students notice that the numbers are located on the lines rather than between those lines?
  3. Ask: If you went to (5, 2) where would you be?
  4. Students learn that the first number in an ordered pair, is the horizontal distance from the origin (0, 0). The second number is the vertical distance from the origin. So (5, 2) represents five squares across and two squares up. That location is just outside the café. If the directions are reversed then students end up at (2, 5) in the forest.
  5. Invite the students to identify other landmarks and give the location of those landmarks using coordinates. For example:
    What is at (6, 2)?   (school)
    What are the coordinates for the Fountain?...the Fire Station?...Ferris Wheel?
  6. Provide students with Copymaster 2 in pairs. Ask them to:
    Put ten new landmarks on the map. Label each landmark, e.g. Hospital, MacDonald’s Restaurant, Skate World, Church, Marae. Students should be encouraged to choose landmarks important to them.
    Write down a set of ten coordinates for the landmarks in the order you want another team to visit them. Try to make the trip an interesting shape.
  7. Once pairs complete their landmarks and coordinates, their map can be given to another pair to document the journey in two ways:
    1. Record the name of the landmark beside each coordinate
    2. Draw the path directly between coordinates in order to see what interesting shape is made. Name the shape.

Session 4

  1. Use a globe to discuss lines of longitude and latitude. Ask: Why might putting a coordinate system over the Earth’s surface be useful?
    Students might think of situations where giving a precise location is important, e.g. Flights to a Pacific Island, searching for lost trampers, tracking ships, etc.
  2. Point out that the Earth is close to a sphere, like an orange, so it is tricky to lay the lines onto a flat space. Lines of longitude emanate from the poles, and lines of latitude finish at the poles.
  3. Give students these names of New Zealand towns.
    Ask: Do you know where these towns are in Aotearoa?
    • Gore                46.1028° S 168.9436° E
    • Raglan             37.8° S 174.8833° E
    • Dargaville        35.9333° S 173.8833° E
    • Wairoa             39.0333° S 177.3667° E
  4. Ask: What do you think the numbers to the right of each town mean?
    Students might suggest that they are coordinates.
  5. Search for a video online using “Longitude and latitude explained.” There are some clear explanations available that students will find easy to understand.
  6. Go to Google Maps NZ. Put in the coordinates for each town in the search bar. Google takes you directly to the town so you can confirm its location. You may need to Zoom out so other familiar parts of Aotearoa are visible.
  7. Draw students’ attention to the use of decimals to more precisely define the coordinates. For example, the longitude of Wairoa is one third the distance between 177 degrees East and 178 degrees East.
  8. Provide your students with Copymaster 3, an old French map of Aotearoa dated at 1896. The map clearly shows lines of longitude and latitude. Ask students to mark the locations of the four towns on the old map.
  9. Watch to see that students:
    Locate the towns using the coordinates
    Use the decimals to get improved precision.
  10. After locating the four towns ask students to use the same map and locate cities, towns, or islands that are significant to them. Exact coordinates can be found using Google Maps or sites such as https://www.geodatos.net/en/coordinates/new-zealand/.
  11. Students might exchange coordinates and find the matching location. You might frame the activity like a Great Race as seen on television. Each location can be a checkpoint.

Session 5

In this session students create a map that will be of future use to them. They screen grab the map from Google Maps and impose their own coordinate or grid system on it.

Using their own map students might write instructions using cardinal compass directions (N, NE, E, SE, S, SW, W, NW) and orientation instructions. In pairs the students follow each other’s instructions. The activity can be made more challenging by asking students to include an appropriate scale on the map.

Attachments

Equality with multiplication and division

Purpose

This unit of work investigates how relational thinking is applied to multiplication and division.

Achievement Objectives
NA3-1: Use a range of additive and simple multiplicative strategies with whole numbers, fractions, decimals, and percentages.
NA3-6: Record and interpret additive and simple multiplicative strategies, using words, diagrams, and symbols, with an understanding of equality.
Specific Learning Outcomes
  • Use relational thinking as a basis for a range of number strategies.
  • Explain number strategies using materials and diagrams.
Description of Mathematics

The equal sign signifies a balanced relationship between the numbers and operations on either side of the sign.

If the numbers on one side of the equal sign are changed, then relational changes must be made to the other side to maintain equality, e.g. seven is added to both sides.

Understanding the relationship between numbers on either side of the equal sign is fundamental in a range of operational strategies. Importantly, it is integral to the solving of increasingly complex equations in algebra.

Two progressions are implicated in students’ development to think in relational ways with multiplication and division equations.

Variables Progression

  1. Unknowns are treated as irreconcilable or ignored
  2. Unknowns are treated like specific ‘missing’ numbers
  3. Unknowns are treated as possibilities, that is they can take up various values
  4. Variables are related to other variables without needing to be evaluated

Multiplicative Progression

  1. Equal sets are counted or shared one item at a time
  2. Equal sets are counted, added or shared in composites, e.g. skip counting
  3. Multiplication facts are worked out (derived) from known facts, or simply known
  4. Properties of multiplication and place value are applied
  5. Multiplication is connected to division

This unit aims at phases 2-4 of the ‘Variables’ progression and 3-5 of the ‘Multiplicative’ progression.

Opportunities for Adaptation and Differentiation

The learning opportunities in this unit can be differentiated by providing or removing support to students, or by varying the task requirements.  Ways to support students include:

  • making connections between this learning, previous learning around multiplication and division, and between the counting of units in arrays
  • using materials to support students who find it difficult to understand the properties of multiplication. Ultimately, students should appreciate the transformations on the quantities involved
  • asking predictive questions to help students think abstractly sbout concepts rather than rely on physical representations. Symbols are extremely important in connecting different situations, and some students recognise patterns in equations more readily than in other representations.
  • encouraging sharing and discussion of student's thinking
  • using collaborative grouping (mahi tahi) so students can support each other, share strategies, and experience both tuakana and teina roles.

Ways to extend students include:

  • encouraging students to generalise the properties of multiplication and how those properties transfer to division, the inverse operation
  • identifying and describing operations that can be performed on both sides of an equation that leave the equality invariant.

The contexts for this unit can be adapted to suit the interests and cultural backgrounds of your students. For example, you could look for arrays in the following ways and use them as contexts for multiplication and division problems: 

  • lining up for kapa haka performances
  • apple trees growing in an orchard
  • lineouts in rugby games
  • muffins baking in trays
  • Weet-Bix stacked in a box

Te reo Māori vocabulary terms such as whakarea (multiply, multiplication), whakawehe (divide, division), taurite (balance), paheko kōaro (inverse operation), paheko (operation), and ōrite (equal) could be introduced in this unit and used throughout other mathematical learning.

Activity

Session 1

This session explores how relational thinking applies to multiplication, with a focus on the commutative and distributive properties. When designing arrays problems consider, and encourage students to think about, contexts in which the arrays might be relevant (e.g. 5 rows of 3 kiwi eggs lined up in an incubation pod). It is also important to consider what multiplication facts will allow students to easily understand the idea of “arrays” and which multiplication facts might act as a cognitive barrier. Group students with different levels of multiplication-facts understanding to encourage tuakana-teina.

  1. Discuss why this multiplication equation is true, and what the relationship is between the numbers on the left of the equal sign and the right: 3 x 5 = 5 x 3. Note that some students will evaluate both expressions, 3 x 5 and 5 x 3, and conclude “both sides work out to 15”. Others may note that the factors are reversed in order (the commutative property).
     
  2. Physically model the equality of 3 x 5 and 5 x 3, by creating arrays like the one displayed below. Arrays could be created using a digital platform (e.g. Google Slides), physical materials (e.g. counters), or drawn.
    An array of pūkeko in five rows of three.
    Can students explain which array models 3 x 5 and why? (3 x 5 represents either three rows of five or five rows of three so either answer is justifiable)
    Some students may recognise that one array is a quarter turn of the other.
  3. Pose similar examples, such as 4 x 6 = 6 x 4 and 2 x 7 = 7 x 2. Ask students to construct a single array (using Copymaster 1) for each equation and show where the factors are found, i.e. rows or columns.
     
  4. Provide equations with unknowns in different ‘locations’, e.g. 8 x 5 = 5 x ? and 6 x ? = 3 x 6. Can students find the unknown without evaluating the given side of the equation?
     
  5. Provide Copymaster 2 to the students with minimal guidance. The worksheet provided examples of the distributive property. For example, 3 x 7 = 3 x 5 + 3 x 2. Let the students work collaboratively (mahi tahi) in small groups.
     
  6. Gather the class to share the answers. Highlight that the word ‘distribute’ means to share out. One or both factors are shared, e.g. With 3 x 7 = 3 x 5 + 3 x 2, 7 is distributed into 5 and 2. 
     
  7. Give examples of the distributive property where the unknowns are in different ‘locations’, e.g. 5 x 13 = 5 x ? + 5 x 3 or 3 x ? = 3 x 6 + 3 x 6. You might construct arrays to show some equations.

Session 2

  1. Discuss why this multiplication equation is true, and what the relationship is between the factors on the left of the equal sign and the right: 14 x 5 = 7 x 10
     
  2. Re-arranging a 14 x 5 array to become 7 x 10 will help students to understand that nothing has been added to or taken away from the array, so there will be the same number of pūkeko. (see Copymaster 1).
    Diagram showing rearranging a 14 x 5 array to become a 7 x 10 array, showing that nothing has been added to or taken away from the array.
  3. Relate the re-arrangement of the array with the more abstract equation representation:
    An abstract equation representation showing the equality of 14 x 5 and 7 x 10.
     
  4. Do your students recognise that the equality is conserved if one factor is halved while the other is doubled?
     
  5. Give students some multiplication equations like the following. Ask them to decide whether, or not, each equation is true. Do students accept the equality without working out the products on either side of the equal sign? (Bold equations are true)
    8 x 5 = 4 x 10
    12 x 4 = 6 x 8
    14 x 3 = 6 x 6
    4 x 15 = 2 x 30
    18 x 50 = 8 x 100
    6 x 7 = 2 x 21
     
  6. You might build arrays of each product (on opposite sides of equals). Ask how one array can be transformed into the other by cutting and pasting. Connect the cutting to halving one factor and the pasting to doubling the other factor.
     
  7. The following multiplications require students to think about the multiplicative relationship between the factors on either side of the equal sign. Frame these equations in a context that is relevant to your students. It is important to get students to explain and discuss their strategies. Ask students to use arrays to show how their strategies work, in situations where they seem uncertain.
    16 x ? = 8 x 10
    12 x 10 = ? x 5
    ? x 3 = 9 x 6
    8 x ? = 4 x 12
    24 x 50 = ? x 100
    4 x 9 = ? x 3
     
  8. Show PowerPoint 1 to the students. Slide One shows examples of identifying a relationship between two equations. Ask your students what relationships they see among the factors in the equations. Record the pairs as equations, e.g. 6 x 4 = 3 x 8. Slide Two shows examples of equations connected by the distributive property. Trios of equations can also be combined into a single equality, e.g. 2 x 11 + 4 x 11 = 6 x 11
     
  9. Provide the students with Copymaster 3 which is a Times Tables Chart. Ask them to the find duos and trios of connected equations. Can they write each duo and trio as a single equality?
     
  10. Extension: High achieving students might extend their thinking into equations that contain variables. What values for the heart (♥) and diamond (♦) work for each equation? Note that there is an infinite set of possibilities for each equality.
    4 x ♥ = 8 x ♦
    ♦ x 9 = ♥ x 3
    12 x ♥ = ♦ x 6
    ♥ x 25 = ♦ x 100

Session 3

  1. In this session the properties of multiplication are extended to division, using the same array presentation as previously. 
     
  2. Use PowerPoint 2 to navigate the instruction. The two multiplication equations come from ‘seeing’ the equal sets as rows or columns in the array. For example, Slide One shows 3 x 8 as “three rows of eight” and 8 x 3 as “eight columns of three”. Slide Two shows the corresponding division equations, 24 ÷ as “the number of rows of eight in 24” and 24 ÷ 3 as “the number of columns of three in 24”. Note that division is interpreted as measurement, that is, “How many sets of x go into z?”
     
  3. Provide your students with Copymaster 1 and Copymaster 3. Ask them to identify a multiplication basic fact on Copymaster 3, mark or cut out the matching array on Copymaster 1, then record the two multiplication and two division equations in their workbook. Then, have them explain to a partner where the four equations can be ‘seen’ in the array. Ensure students have opportunities to experience both tuakana and teina roles with this task.
     
  4. Are there examples where there is only one multiplication equation and one division equation? With square arrays, such as 6 x 6 , there is only one division equation, 36 ÷ 6, since both factors are the same.
     
  5. Pose the following division word problems and have the students work together to solve them. The context for these problems should be adapted to reflect the context of your class. Copymaster 3 can be used by students as reference point
    • A local business has donated 36 apple trees to be planted in the community garden at the marae. Gina wants them to be in rows of 4 trees. How many rows of apple trees could she make? Can you draw a diagram of this?
    • Another business has donated 32 pear trees to be planted in the same garden. Hoani wants to plant these trees in 8 rows. How many should be in each row? Can you draw a diagram of this?

      Give the students the following division problems and have them collaborate (mahi tahi) with a partner to solve them. Allow them to use Copymaster 3 to support them if necessary.
      18 ÷ 3 = ?
      36 ÷ ? = 9
      ÷ 5 = 8
      28 ÷ ? = 4
      48 ÷  6 = ?
      28 ÷ ? = 4
      35 ÷ ? = 7
      ÷ 3 = 21
      Discuss which facts you look for to solve ? ÷ 3 = 21.
      Do your students look in the three times tables to look for a product of 21?
      Construct arrays where necessary.
       
  6. Slide Six of PowerPoint 2 has a multiplication grid with many of the factors missing. Challenge your students to copy the grid into their workbook and complete it so that all the facts work. Animations on the slide can be used to get them started and provide the solution once students have worked on it.
     
  7. Discuss the best way to approach the solving of the grid.
     
  8. Extension: High achievers might enjoy creating grids for other students to solve.

Session 4

In this final session students work on the relationship between the distributive property of multiplication and strategies for solving division problems.

  1. Begin with the division problem: 42 ÷ 3 = ?
    What multiplication equation could we write to solve this problem? (? x 3 = 42)
    Both equations are asking us, “How many threes are in 42?”
     
  2. Use Slide One of PowerPoint 3 to work through a solution.
    Where is the answer to both equations?
    Do your students recognise that 10 + 4 = 14 is the number of fours found in 42?
     
  3. Continue with Slides Two and Three of PowerPoint Three to provide other examples of the distributive property applied to division.
     
  4. Give students the following problems to solve in pairs or threes. Provide Copymaster 1 so your students can model the problems with arrays if they need to.
    39 ÷ 3 = ?
    108 ÷ 9 = ?
    56 ÷ 4 = ?
    75 ÷  5 = ? 
    84 ÷ 6 = ?
    91 ÷  7 = ?
    Encourage students to record their strategies using multiplication or division equations. 
     
  5. Share solutions and have a korero about strategies as a class
     
  6. Provide students with Copymaster 4 to work from. The work involves dividing 72 into various measures. Look for students to:
    • Leverage off previous answers, e.g. If 72 ÷  4 = 18 then what is 72 ÷ 8? There are half as many eights, as there are fours, in 72.
    • Apply the distributive property of multiplication to division, e.g. 10 x 4 = 40, and 8 x 4 = 32, so 18 x 4 = 72.
    • Creatively combine strategies where a fact is unknown, e.g. 2 x 16 = 32 so 8 x 4 = 32, using doubling and halving with the commutative property.
       
  7. High achieving students can look at all the possible equal teams that can be created with numbers like 72, 96, 100, 120 or 144 pūkeko. This can lead to methods of finding all the factors, and divisibility rules (see Pages 72-74 of Teaching Multiplication and Division)

Carrots

Purpose

In this unit we investigate the amount of water contained in a carrot and we use a time series graph to plot the "weight" of the carrot as the water in the carrot evaporates. The students also pose their own carrot investigative questions.

Achievement Objectives
S3-1: Conduct investigations using the statistical enquiry cycle: gathering, sorting, and displaying multivariate category and wholenumber data and simple time-series data to answer questions; identifying patterns and trends in context, within and between data sets;communicating findings, using data displays.
Specific Learning Outcomes
  • Plan a statistical investigation using the PPDAC cycle.
  • Choose an appropriate data display (bar graph, dot plot, time series graph).
  • Make statements about the findings of the investigation.
Description of Mathematics

The key idea of statistical investigations at level 3 is telling the class story with supporting evidence. Students are building on the ideas from level two and their understanding of different aspects of the PPDAC (Problem, Plan, Data, Analysis, Conclusion) cycle – see Planning a statistical investigation – level 3 for a full description of all the phases of the PPDAC cycle.  Key transitions at this level include posing summary and time-series investigative questions, and collecting and displaying multivariate and time-series data.

Summary or time-series investigative questions will be posed and explored throughout this unit.  Summary investigative questions need to be about the group of interest and have an aggregate focus. For example, How many seeds are in a carrot packetWhat do carrots weigh? These questions also need to define the variable and the time period for the investigation. For example, How does the weight of the carrot change over the course of the week? (variable – weight of the carrot; time period – one week).

Time series graphs

Time series graphs are used to display numerical data over time. The numerical variable of interest is on the vertical axis. Time is represented on the horizontal axis. For example, the graph below shows the distance travelled each day by an elephant seal (the numerical value) from May 2005 to January 2006 (the time).

A time series graph showing the distance travelled each day by an elephant seal from May 2005 to January 2006.

Opportunities for Adaptation and Differentiation

The learning opportunities in this unit can be differentiated by providing or removing support to students and by varying the task requirements. Ways to support students include:

  • setting up the plan for data collection for students to follow
  • varying the type of data collected; categorical data can be easier to manage than numerical data
  • varying the type of analysis expected from students, and the support given to students doing the analysis
  • providing pre-prepared graph templates
  • providing prompts for writing descriptive statements
  • providing teacher support at all stages of the investigation
  • creating opportunities for students to work in flexible groups, in which they can support each other and share their thinking.

The context for this unit can be adapted to suit the interests, experiences and cultures of your students. You could look at the weight of an animal over time, or record growth of a seedling. Alternatively, you could make links to the development of a local school or community garden, links to science-based learning (i.e. around the growth of different plants), or links to crops of fruits and vegetables that were traditionally, or are currently, grown in your local area. The statistical enquiry process can be applied to many topics and selecting ones that are of interest to your students should always be a priority. 

Te reo Māori vocabulary terms such as tauanga (statistics), raraunga (data), tātari (analyse) and huritao (reflection, reflect upon) could be introduced in this unit and used throughout other mathematical learning.

Required Resource Materials
  • Scales (finely calibrated)
  • Graters
  • 1 kg of carrots
  • Packets of carrot seeds
  • Other materials depending on the investigations chosen
Activity

Getting Started

  1. We begin the unit by bringing along a kilogram of carrots and posing the investigative question (problem): How much of a carrot is water? Discuss the food crops that are grown in your local community, and the benefits and disadvantages of growing your own food. Students may be engaged in discussion around the cost of living; land, materials and labour required to build a garden, and how a garden might encourage healthy eating. You could also investigate crops that are of historical significance to your area (e.g. carrots in Ohakune, stone fruit in Central Otago).
  2. Get the students to brainstorm how much they think. Encourage all answers. Conclude by asking the students to estimate as a percentage of its weight.
  3. Ask: How can we find out? (plan)
    Again get the students to share their ideas.
  4. Select one of the ideas to use as the plan to answer the investigative question. One way is to weigh the carrots, without the green tops, then grate them and leave the carrots to dry in the sun. You could also use a dehydrator or an oven on very low heat.
  5. In addition to planning what to do, students need to think about how they will record the data. Support them to consider the following:
    • How often will they weigh the carrots?  Suggest twice daily – beginning of the school day and end of the school day.
    • How will they weigh the carrots? The carrot can be weighed by itself, but what about once it is grated?  Suggest weighing the carrot, weighing a container to put the grated carrot in, then grating and weighing the grated carrot plus the container. 
    • What information will they collect, and how will they record it? Suggest using a table on a device or paper, for example:
       

      Weight of carrot at start: _____________      Weight of container: _________

      DayTimeWeight container plus carrotWeight carrot only
      1Initial  
      2Morning  
      2Afternoon  
      3Morning  
      3Afternoon  
      4Morning  
      4Afternoon  
      5Morning  
      5Afternoon  

                  Final weight of carrot once dehydrated: __________
       

    • When will they stop recording information? After about a week the carrot should be dried out completely.
  6. Working in pairs, get students to enact the plan and record the initial weight of their carrot (data), grate it and put it into the container.
  7. For the remainder of the week repeat the weighing process every morning and afternoon until the carrot is dried out completely (data). If this has not happened by the end of the week, resume recording the weight the next week. We still have to find the final weight after the carrot has dried completely to answer our investigative question and we will still have the weight of the carrot over the week to make a time series display in the final session.
  8. Depending on the time you have available you could also collect the initial carrot weights from each pair and display these using a dot plot. The investigative question would be: What are the initial weights of the carrots we have? Data can be collected directly onto a class dot plot on the board or a chart.  Ask students to describe the graph by stating what they notice.  Include the variable, values, and units in descriptive statements.  For example, they might notice that most of the carrots we are using weigh between 80g and 150g. The lightest carrot is 65g.

Exploring

Over the next three days the students in small groups plan and conduct their own carrot investigation.

  1. Brainstorm some other things that the students could find out about carrots. Some ideas include :
    • How many seeds are there in a packet of carrot seeds?
    • Is it cheaper to grow or buy carrots?
    • Where is the cheapest place to buy carrots this week? 
    • Is there a relationship between the length of the green top on a carrot and the length of the carrot? 
    • Do carrots get a fair deal in the Frozen Mixed Vegetables Packets?
  2. Allow the students to select and plan their investigation, collect their data and interpret it.
  3. It is important that you circulate around the groups asking questions that help the students plan and make sense of their investigation. In the early stages it is important that they have a clear strategy for collecting data that will help answer their investigative question.
  4. Ask the students to prepare a presentation (oral, digital, or hard copy), supported by a graph, for sharing with the class on the final day of the unit.

Reflecting

On the final day we look at and interpret the findings of our first investigation – How much of a carrot is water. We also share our small group investigations with the class.

How much of a carrot is water?

  1. As a class, discuss the final weight of their carrots and work out what percentage of their carrot must have been water because it has evaporated (analysis).
  2. Ask the students, in pairs or small groups, to present this fact in an interesting way. (One idea is to draw a carrot with the percentage of water coloured blue and the remainder orange.)
  3. In addition to this information about the percentage of water in a carrot, ask the students to show how the weight of the carrot changed over the course of the week (analysis). (There are a few considerations here: has the carrot completely dried? If not, then this reflection session might need to happen in a few days; if they are all completely dried then the final measurement might have been the morning of the 5th day, so a further afternoon reading won’t be needed, or if they have plateaued earlier i.e. fully dried then further recording is not necessary). Students should use a time series graph for this. 
  4. The final presentation should include the percentage of water for their carrot and a time series graph for their carrot showing the weight over the week.  The presentation should also include at least two statements describing what the displays show (communicating findings).
  5. Display around the class or as a slideshow. Students can look at the displays of other students and see how they compare with their findings.

Small group investigations

  1. In their small groups, students present their findings orally supported by a graph.
  2. Graphs can also be displayed around the class after the presentation.

Fridge Pickers

Purpose

In this unit, using our fridge as the context, we collect and present data using dot plots and bar graphs. We start to learn about using the computer to display our data and explore features of data display.

Achievement Objectives
S3-1: Conduct investigations using the statistical enquiry cycle: gathering, sorting, and displaying multivariate category and wholenumber data and simple time-series data to answer questions; identifying patterns and trends in context, within and between data sets;communicating findings, using data displays.
Specific Learning Outcomes
  • Plan a statistical investigation.
  • Display data in dot plots, strip graphs and bar charts.
  • Discuss features of data display using middle, spread, and outliers.
Description of Mathematics

Planning an investigation at Level 3 of the New Zealand Curriculum is more complex than at Level 2. At Level 3, students refine their understanding of statistics by conducting investigations that make use of the statistical enquiry (PPDAC) cycle. PPDAC stands for problem, plan, data, analysis, and conclusion. Within this, students begin to talk about situations they have experienced, pose investigative questions, produce plans for a statistical investigation, and may utilise digital graphing and survey tools (i.e. on the computer) in their work. 

In this unit the students are introduced to dot plots and bar graphs. The way in which they will need to collect and organise their data is dependent on the nature of their investigative questions. They should start to see, and be able to talk about, distinctive features of their displays such as the groupings and modes. The unit of work Planning a statistical investigation (level 3) provides a full description of all phases of the statistical enquiry cycle.

Dot plots

Dot plots are used to display the distribution of a numerical variable in which each dot represents a value of the variable.  If a value occurs more than once, the dots are placed one above the other so that the height of the column of dots represents the frequency for that value. Sometimes the dot plot is drawn using crosses instead of dots. Dot plots can be used for categorical data as well.

An example of a dot plot.

Bar graphs

In a bar graph, equal-width rectangles (bars) represent each category or value for the variable. Usually, gaps are included between the bars to demonstrate the distinct, discrete nature of the categorical data (i.e. that each bar represents a different category or whole number). The height of these bars tells how many of that object there are.  The bars can be vertical, as shown in the example, or horizontal.

 An example of a bar graph.

The example above shows the types of shoes worn in the class on a particular day. There are three types of shoes: jandals, sneakers, and boots. The height of the corresponding bars shows that there are six lots of jandals, 15 lots of sneakers and three lots of boots. It should be noted that the numbers label the points on the vertical axis, not the spaces between them.  

Opportunities for Adaptation and Differentiation

The learning opportunities in this unit can be differentiated by providing or removing support to students and by varying the task requirements. Ways to support students include:

  • setting up the plan for data collection for students to follow
  • the type of data collected; categorical data can be easier to manage than numerical data
  • the type of analysis – and the support given to do the analysis
  • providing pre-prepared graph templates to support developing scales for axes
  • providing prompts for writing descriptive statements
  • teacher support at all stages of the investigation
  • providing opportunities for students to share their learning, work in pairs (a tuakana/teina relationship may suit) or work in small collaborative (mahi tahi model).

This unit uses food and students’ fridges as a context for investigations. When implementing this unit, be aware of your students’ socio-economic backgrounds. Access to food may be a sensitive topic for some students. Therefore, this context can, and should, be adapted to suit the interests and experiences of your students. The statistical enquiry process can be applied to many topics and selecting ones that are of interest to your students should always be a priority.

Te reo Māori vocabulary terms such as tūhura (investigate), rapanga (problem) and kohikohi raraunga (data collection) could be introduced in this unit and used throughout other mathematical learning.

Required Resource Materials
Activity

Session 1

We begin the week collecting fridge data about our class. We use this information to start to explore new types of data displays. 

  1. Tell the class that this week they will be investigating Fridge Pickers.
    What do you think a fridge picker is?
    Collect ideas from the class and record them on a hard-copy or digital chart.
  2. Tell the class that the first thing we will investigate is What types of foods do the students in our class like to pick from the fridge? This is the investigative question (our problem).
  3. As part of the planning for the investigation we need to decide how we will collect the data that we need to answer the investigation question. We will use the following survey question – What type of food do you like picking from your fridge?
  4. Pose the investigative question to the class. List students ideas on the board and then group the answers into 5-6 categories. Make sure to include an “other” category. Emphasise that the use of categories is important. If every student contributed a different answer (i.e. which might happen without the use of categories), it would be difficult to compare the data in an in-depth manner. As a class, develop the final survey question: What type of food do you like picking from your fridge – choose from: OPTION 1, OPTION 2, OPTION 3, OPTION 4, OPTION 5, OTHER please specify _________
  5. Introduce the addition of another variable (i.e. a quantity to be measured) to the data set. It might be interesting to compare the favourite fridge pickings of students from different cultures, or to compare whether a student's place in their family has any effect on their favourite fridge pickings. To explore the latter idea further, data could be collected on each student's position in their family and their favourite type of food to pick from the fridge. You might discuss the following points:
    • How do we define position? Eldest – no siblings older than you; Middle – have older and younger siblings; Youngest – you have older sibling(s), but no siblings younger than you.
    • An only child would be a singleton or only child (more acceptable now)
    • If there are two children then there is an eldest and a youngest
    • From three children onwards a middle child (or children) becomes possible.
  6. Give students a small, coloured square of paper (or a sticky note) based on their position in the family.  For example: Eldest child – yellow; middle child – green; youngest child – blue.  Ask them to give the answer to the survey question: What type of food do you like picking from your fridge? They select one of the categories to either write or draw on the paper. If appropriate this could be completed digitally (e.g. with the use of Google Forms). Collect the data.
  7. Ask the students to sort the squares to make a bar graph (analysis).  If possible, take a photo of the display, upload into a google doc or similar and capture student statements about the display.
    What statements can you make about us as fridge pickers? (analysis)
  8. If it has not come up, ask the students what they notice, if anything, about the colours in the graph. Maybe rearrange the squares so that the same colours are together in each of the stacks. Take a picture of the new display and add to the document.
    Does the display show us anything different?
  9. Rearrange the squares so that the same colours are together in a bar graph.  What does this now show us? The distribution of position in the family. What do you notice about this graph? (Take a picture of the new display and add it to the document). E.g. More people are the youngest in their family in our class than are the eldest in our class.
  10. Sort the squares in the family position stack into groups by the type of food they like to pick. (Take a picture of the new display and add  it to the document). How is this display different to the one we had when we had sorted by type of food?  Does it give us any different information?
  11. Communicate findings (conclusion). Refer to the investigative question at the start: What types of foods do the students in our class like to pick from the fridge?  and write and answer based on the findings from the explorations above. Give the students the opportunity to discuss their findings with a buddy. 

Preparation for data collection for a home-based activity

  1. Ask:
    How many people in your family do you think are fridge pickers?
    What time of the day do you think people fridge pick?
    How could we find out?
  2. Show the students the Fridge Pickers (Copymaster 1) dot plot and highlight its features. Explain that they are to use it at home one day this week to investigate fridge pickers. Each time a person opens the fridge to pick they are to put a X beside the time. If you want to add individual detail, ask each member of the family to use a different coloured pen or to write their Initial instead of a X. The dot plots are to be brought to school for the activity in session 5.

    A dot plot showing the times when the fridge is picked.
  3. As a class, make predictions about the information they will gather.
    We think that:
    Our fridges will be opened the most before teatime.
    That no one will open the fridge between midnight and 6 am.
  4. Ask each child to write an additional 1-2 statements about who they think will open the fridge the most in their home and when the most popular times will be.

Sessions 2-4

Over the next three days the students gather information around the theme of fridges or food. They will collect and record the data in a spreadsheet or data table in a software package that allows them to draw statistical displays. In this unit we use CODAP, but other software tools can also be used. Look for tools that allow students to access the raw data (i.e. one row containing the responses for each person or object they collect data on) rather than needing summarised data.  Using the statistical graphing tool students will display the information using dot plots and bar graphs, and make statements about what the data shows. If you do not have access to computers then provide students with blank templates to make their dot plots (Copymaster 2) or bar graphs (Copymaster 3).

PROBLEM: Generating ideas for statistical investigation and developing investigative questions

  1. Brainstorm ideas for other fridge or food investigations. List these on the board. Some ideas could include:
    • What drinks do we keep in our fridges?
    • What type of fridges do we have?
    • What types of yoghurt do we like?
    • What types of vegetables and meat do we keep for boil ups?
    • What are our favourite leftovers in the fridge? For example, paua patties from the day before, cooked titi, food from the hangi, or toroi (prepared fern fronds) or even raw oysters?
    • What special-occasion food do we find in the fridge around certain times (e.g. Christmas, Matariki, birthdays).
    • What brands of margarine do we prefer?
  2. Let the students work in pairs to investigate using the PPDAC cycle. Consider pairing together students of mixed mathematical abilities to encourage tuakana-teina. Ask the students to select a topic. You may choose to provide a list of appropriate and/or relevant topics to encourage purposeful investigations. If two or more pairs want to do the same investigation, let them do so. When it comes to sharing findings, remember to compare results.
  3. Students develop an investigative question(s) based on their topic. These are the questions they ask of the data; it will be the question(s) we explore using the PPDAC cycle.
    Prompts to help with posing investigative questions include:
    • What is the variable that you want to ask about?
    • Describe the group that you are asking about.
    • Do you want to describe something (summary) or compare something (comparison)?
      • Summary questions have one variable and one group e.g. What types of fridges do we have? [type of fridge, we (our class)]; What brands of margarine do the students in Room 23 prefer [preference of margarine brand, students in Room 23]?
      • Comparison questions have one variable and two or more groups e.g. How do the types of yoghurt our class like compare with the types of yoghurt Room 21 like?
  4. Check the investigative questions that students have posed. Gather them in e.g. write on the board, type into a google doc or write on paper to be pinned up. As a class check each investigative question for the variable and the group and the remaining criteria:
    • Is the question purposeful? 
    • Is the question about the whole group? Check that it is not just finding an individual or smaller group of the whole group.
    • Is the question one that we can collect data for? 
    • Is it clear that the question is a summary investigative question or a comparison investigative question?
  5. Get students to make a prediction about what they will find as a result of their investigation.

PLAN: Planning to collect data to answer our investigative questions

  1. Students need to develop survey questions to answer their investigative question. For example, if they are exploring the investigative question What are the types of fridges we have? they will need to get information to answer this question. 
  2. Survey questions are how they get the information. In thinking about their investigative question, the students decide they want to find out about the make and the style of the fridge. They pose two survey questions: (1) What is the make of your fridge? and (2) What type of fridge do you have? In discussion with another pair at their table they wondered about what would happen if people had two fridges because one of the students at the table said they had a fridge in the kitchen and one in the garage that was used for drinks and extra food.  They decided to add to their survey questions – if you have more than one, pick the one that is your main fridge.
  3. Once the students have developed their survey questions they should list some options for people to choose from:
    For example: Make of fridge question – using the internet they found 15 different makes of fridges so they picked six that they knew and added an “other” category.
    Categories: Fisher and Paykel, Haier, LG, Samsung, Simpson, Westinghouse, Other  Type of fridge question – using the internet they found the following categories for refrigerators: All refrigerator, Top (freezer) mount refrigerator, Bottom (freezer) mount refrigerator, single-door refrigerator with freezer capacity, Side by side refrigerator, French door model refrigerator, other.
  4. Finally, the students need to prepare instructions to indicate how others are to respond to their survey questions. At this stage they should also think about how to collect the data, for example using a table to record responses or a digital survey tool (e.g. Padlet, Google forms).

    Your name

    Q1. What is the make of your fridge? If you have more than one, pick the one that is your main fridge. Choose from:

    • Fisher and Paykel
    • Haier
    • LG
    • Samsung
    • Simpson
    • Westinghouse
    • Other – please specify

    Q2. What type of fridge do you have? If you have more than one, pick the one that is your main fridge. Choose from:

    • All refrigerator
    • Top (freezer) mount refrigerator
    • Bottom (freezer) mount refrigerator
    • Single-door refrigerator with freezer capacity
    • Side by side refrigerator
    • French door model refrigerator
    • Other – please specify
       
       
  5. To check the clarity of the survey questions and instructions have pairs exchange and check one another’s.
    Read the directions.
    Are they clear to you?
    Can you tell what you are supposed to do?
    What do you think they need to change to make the directions clearer?
  6. Allow time for the survey questions and instructions to be modified.

DATA: Collecting and organising data

  1. Tell the pairs to leave their instructions and tables to record the responses at their desks. This could be in paper format or electronic.  Electronic versions could be set up directly in a spreadsheet (e.g. Google Sheets, MIcrosfot Excel) or on a digital document containing a table (e.g. Microsoft Word, Google Docs). Give students time to complete each others' surveys.

    Your name

    Q1. What is the make of your fridge? If you have more than one, pick the one that is your main fridge. Choose from:

    • Fisher and Paykel
    • Haier
    • LG
    • Samsung
    • Simpson
    • Westinghouse
    • Other – please specify

    Q2. What type of fridge do you have? If you have more than one, pick the one that is your main fridge. Choose from:

    • All refrigerator
    • Top (freezer) mount refrigerator
    • Bottom (freezer) mount refrigerator
    • Single-door refrigerator with freezer capacity
    • Side by side refrigerator
    • French door model refrigerator
    • Other – please specify
    MelinoSimpsonBottom mount
    NgaireFisher and PaykelBottom mount
    WiremuFisher and PaykelBottom mount
    TuiLGFrench door model
    AnnaHaierSide by side
    JimmyOther – DaewooTop mount
    JacksonFisher and PaykelSide by side
  2. After the surveys have been completed the pairs return to work with the data collected.
  3. If an electronic means of collecting the data was not used, get students to enter the data collected into a spreadsheet or a data table in CODAP.  A simple way to do this is using the table tool in CODAP.  See this video on how to do this. If students already have the data in a spreadsheet see this video on how to import data from a spreadsheet into CODAP.

ANALYSIS: Making and describing displays

An introduction to using CODAP as a tool for statistical investigations is explained in full in Planning a statistical investigation – level 3 (session 5).

As mentioned earlier if you do not have access to computers then provide students with blank templates to make their dot plots (Copymaster 2) or bar graphs (Copymaster 3).

Possible examples of the types of information students can get on CODAP is below.  In these examples the investigative question What are the types of fridges we have? is explored by graphing the two variables separately and then combined.

Bar graph showing what brands of fridges we have.Bar graph showing what types of fridges we have.

These first two graphs show the make and then the type of fridge.  Because we are using technology, we can also quickly explore the combination of the two variables.

Graph comparing types of fridge and makes of fridge.

Once students have generated their graphs, they can start to describe the displays.

To describe the display, encourage students to write “I notice…” statements about their displays. If students are not sure what to notice the teacher can prompt further statements by asking questions such as:

  • What do you notice about the most common …?
  • What do you notice about the largest number… the smallest number…?
  • What do you notice about where most of the data lies…?
  • What do you notice about the most popular… least popular…?
  • What do you notice about the type of fridge for Fisher and Paykel compared with the type of fridge for Mitsubishi (more specific example for a comparison) …?

Check the “I notice…” statements for the variable and reference to the group.  For example: “I notice that the most common make of fridge for our class in Fisher and Paykel.” This statement includes the variable (make of fridge) and the group (our class). Support students to write statements that include the variable and the group.

CONCLUSION: Answering the investigative question

  1. Discuss with students the features that you want them to include in their report (or poster) of the statistical investigation. The reports could include:
    • Their investigative question .
    • What they predicted they would find as a result of their investigation.
    • A description of how the data was collected, including their survey questions and any decisions they made and why.
    • The data displayed using bar graphs and/or dot plots.
    • A written description of the data and an answer to their investigative question.
  2. Display the completed investigations. Give the students time to look at the other investigations before discussing.
    Tell some of the things you learned from the investigations. What are the preferences of students in our class?
    What was the most popular choice in your survey?
    How can you tell?
    How many students made that choice?
    Which display is most effective?
    Did you have any unexpected results?
  3. Compare investigations completed by more than one pair.
    Do these displays look alike?
    Did the two surveys have the same choices for you to make?
    What differences are there between the investigations?

Session 5

In today’s session we use the data we have gathered at home to examine our initial predictions about fridge pickers.

  1. We begin this session by looking at the dot plots that the students have created at home.
    What can you say about your chart?
    Which times of the day are the busiest for fridge pickers? Why?
    Which times of the day are the quietest? Why?
    Who opens the fridge the most often in your home?
  2. Ask the students to make a poster displaying the results of their fridge picker investigation. List the requirements for the poster for the students to complete, for example:
    • Display your data using a dot plot
    • Label your dot plot
    • Give your poster a title
    • Make three statements telling things you have learned about the fridge pickers in your family.
  3. Discuss ideas for making a classroom display of the posters.
Attachments

Printed from https://nzmaths.co.nz/user/75803/planning-space/late-level-3-plan-term-1 at 2:35am on the 1st July 2024