This is a level 2 number activity from the Figure It Out series. It relates to Stage 5 of the Number Framework.
A PDF of the student activity is included.
Click on the image to enlarge it. Click again to close. Download PDF (475 KB)
add and subtract one digit numbers from two digit numbers
Dice
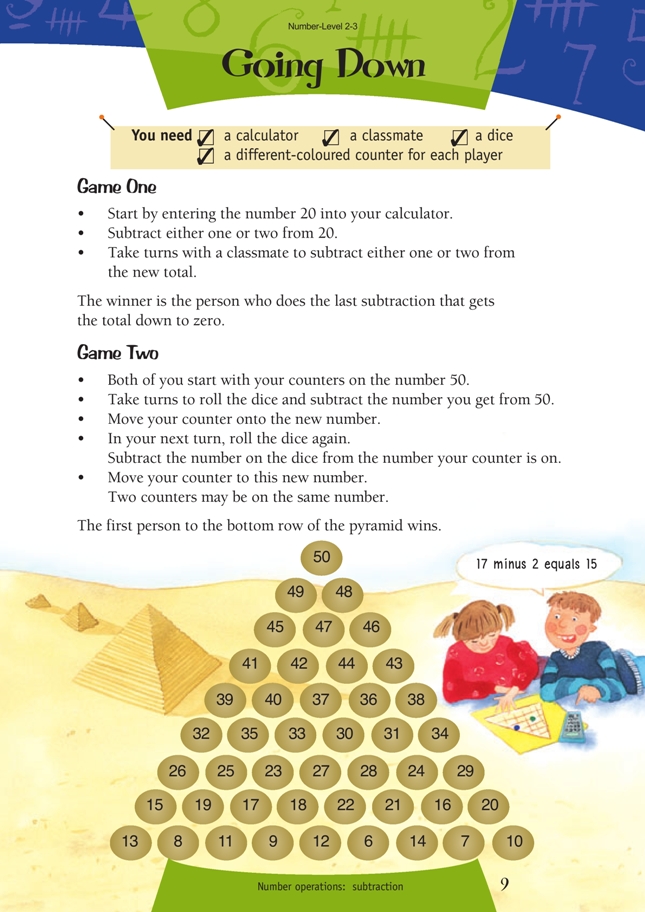
FIO, Level 2-3, Number, Going Down, page 9
Different coloured counter for each player
Classmate
Game One
This is a calculator version of the game Num, which is played with counters. Students are likely to play the game without a strategy to start with. They may realise that if they can finish their turn with the window showing three, they can win, no matter what move their opponent makes.
For example:
Similarly, if they can finish a turn on six, they can bring the total to three in their next turn and go on to win the game (no matter what their opponent does). If they finish a turn on nine, they can bring the total to six, and so on.
The game can be adapted by allowing each player to subtract one, two, or three when it is their turn. This will require a winning strategy that aims at multiples of four instead of three.
Game Two
This is a game of chance that requires students to subtract single-digit numbers. Students should perform these calculations mentally. As an extension, data could be gathered about how many throws it usually takes to reach the bottom row. This data could be gathered on a dot plot as students play the game in groups:
The distribution could be explained by looking at the difference between the numbers on the bottom row and the top number, 50. The issue would then become, “How many throws do you need to take away about 40?” Note that the dice average is 3.5, so 40 ÷ 3.5 ≈ 11 is a good indication of the median number of throws needed.
Answers to Activities
Game One
Calculator game
Game Two
Pyramid game