The purpose of this activity is to engage students in sorting and displaying statistical data in a meaningful way.
This activity assumes the students have experience in the following areas:
- Posing questions for statistical investigation.
- Designing and conducting surveys.
- Using samples recognising that they may not represent the population.
- Identifying patterns and trends in data from graphs and tables.
The problem is sufficiently open ended to allow the students freedom of choice in their approach. It may be scaffolded with guidance that leads to a solution, and/or the students might be given the opportunity to solve the problem independently.
The example responses at the end of the resource give an indication of the kind of response to expect from students who approach the problem in particular ways.
A class investigating the question ‘What is the school library being used for?’ came up with the following questionnaire. The responses, are noted beside each question. Display the data in such a way that it will help the class to answer their question.
Room 6B Library Survey
Our Investigation: What are school libraries used for?
| 1 | What is the main thing you do in library time? | Y5/6: | Teachers: | |
| a | Choosing a book for issue | 8 | 3 | |
| b | Browsing the shelves | 4 | 2 | |
| c | Reading/sitting in the reading zone | 11 | 1 | |
| d | Using the internet | 5 | 4 | |
| e | Not sure | 2 | 0 | |
| 2 | How do you get your reading material? | |||
| a | Mostly purchase | 6 | 5 | |
| b | Mostly borrow | 17 | 2 | |
| c | Half & half purchase and borrow | 7 | 3 | |
| 3 | How do you prefer to sit when you are at the library? | |||
| a | At a table | 5 | 6 | |
| b | On a comfy chair | 12 | 3 | |
| c | On bean bags, cushions or floor | 13 | 0 | |
| d | I rarely sit down in the library | 0 | 1 | |
The following prompts illustrate how this activity can be structured around the Analysis part of the Statistical Enquiry Cycle.
Analysis
The analysis section is about exploring the data and reasoning with it.
- Have I reflected back on my question so I am clear what I am trying to find out?
- Do I get ideas about patterns, differences, relationships and trends from just ‘eyeballing’ the table of data?
- Are my important variables categoric, discrete numeric, or continuous (measurements)? (Categoric.)
- What types of display are best to represent my data to look for patterns, and differences?
- What tools will help me to display the data in different ways? What ways are appropriate to my data and help answer my question?
- How might I describe the distribution/s? What language might I use to describe what I see?
- Are there differences among distributions in terms of proportions (part-whole fractions) and differences?
- How do the patterns and differences help me to answer the investigation question?
- What variation can I see in my data? What might be the causes of that variation?
- Can I make preliminary statements about my findings, starting with “I noticed that...”
- Am I developing ideas about what the answer to my question might be?
Examples of work
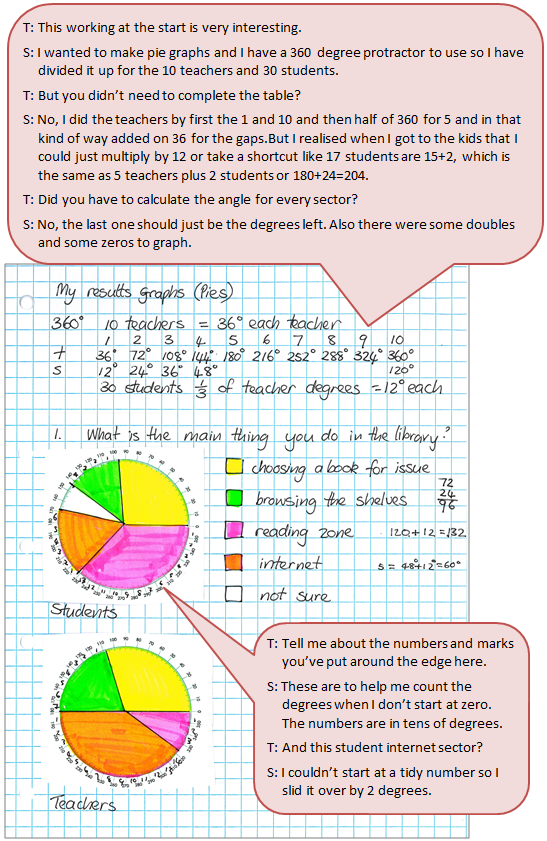
Work sample 1
The student displays category data using pie charts. They accurately represent proprtions for each response on the pie charts.
Click on the image to enlarge it. Click again to close. 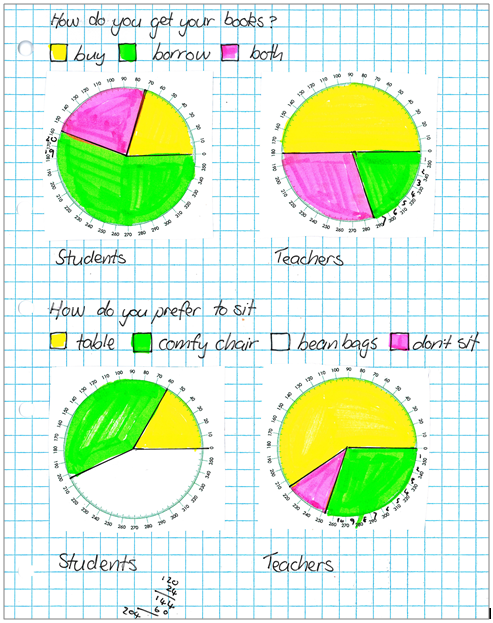
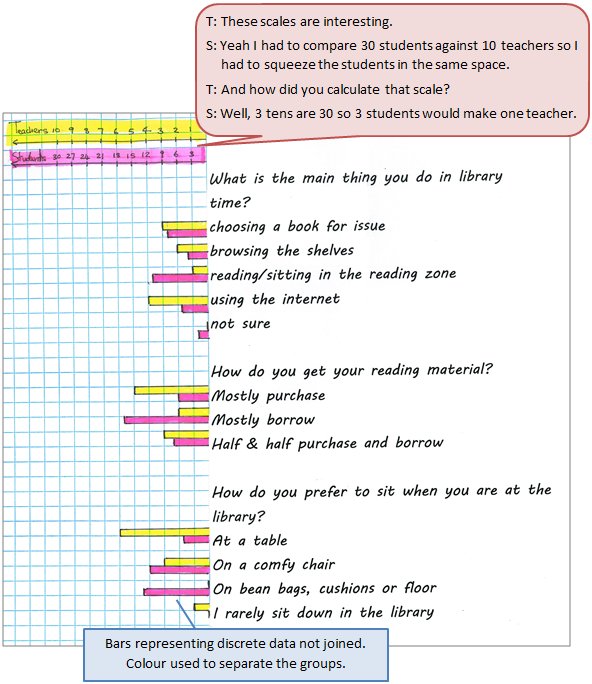
Work sample 2
The student displays category data using bar graphs. They accurately represent frequencies for each response and use the displays to make informed recommendations.
Click on the image to enlarge it. Click again to close.