The purpose of this activity is to engage the students in a practical investigation following the statistical enquiry cycle.
This activity assumes the students have experience in the following areas:
- Calculating mean, median and mode for numeric or measurement data.
- Calculating measures of spread, such as range and Inter-quartile Range (IQR).
- Classifying variables as categoric, discrete numeric or continuous (measurement).
- Posing “I wonder …” questions for statistical investigation.
- Graphing data using manual and digital methods.
The problem is sufficiently open ended to allow the students freedom of choice in their approach. It may be scaffolded with guidance that leads to a solution, and/or the students might be given the opportunity to solve the problem independently.
The example responses at the end of the resource give an indication of the kind of response to expect from students who approach the problem in particular ways.
Task: Which is the noisiest to eat, a carrot or an apple?
Use a decibel meter (or a free app for one on a phone or a tablet) to measure the crunches that you make each time you bite into a carrot and an apple.
Combine your data with the rest of your group to find which makes the loudest crunch.
The following prompts illustrate how this activity can be structured around the phases of the Statistical Enquiry Cycle.
Problem
The problem section is about what data to collect and who to collect it from and why it’s important.
- Is the question a summary, comparison, or relationship question? (It is comparison between two groups, the decibel readings for apple bites and for carrot bites.)
- What variables will be involved? (A variable is both a characteristic and a way to measure that characteristic) (In this case noise is measured by decibel reading on a mobile phone app.)
- How will I organise the data into information that answers my question. (Students should recognise that the data will need to be sorted and displayed to look for patterns and differences in the distributions for apples and carrots.)
- Does this information answer the question?
Plan
The planning section is about how students will gather the data.
- If I need to collect data, how will I measure the characteristic? (Noise is measured in decibels.) Could noise be measured in another way?
- How much time will it take to gather or retrieve my data? Have I got time to do it? Have my subjects got time to participate? How many carrots and apples will I need?
- How large will my sample be? Will my sample size be large enough, or do I need to increase or reduce it? (Students will need to get samples of adequate size, e.g., n = 30, from each food. They also need to consider practical limitations, such as time and amount of carrot and apple.)
- Can I predict possible answers to my question, even before I look at data?
- What might my answer look like? (The answer will be a statement about which food makes the loudest crunch, that is supported by analysis of the data.)
Data
The data section is concerned with how the data is managed and organised.
- How will I make sure the measurement is as accurate as possible and ‘fairly’ measures the characteristic? (Students will need to eliminate, as much as possible, sources of variation. These sources might involve the way the measurement is taken, such as distance to the mobile phone, other noise in the environment, consistency of bite and who takes it, wholeness or incompleteness of the carrot or apple, etc.)
- What format will I use to organise my data as I gather it? (Typing onto a CSV file (spreadsheet) will make the data available for digital tools, such as CODAP, NZLite, and NZ Grapher.)
- How will I protect the data I gather or retrieve so it is safe?
Analysis
The analysis section is about exploring the data and reasoning with it.
- Have I reflected back on my question so I am clear what I am trying to find out?
- Is some data ‘dirty’ (untrustworthy)? How will I clean my data?
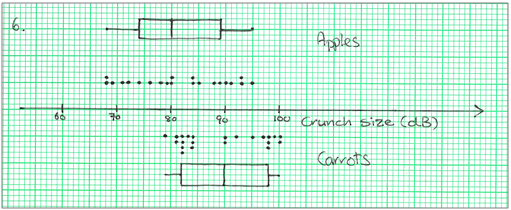
- How can I display different sortings of my data to look for patterns, differences, relationships and trends? (Since the data are measurements, a dot plot with overlapping box and whisker graph is an appropriate display.)
- What tools will help me to display the data in different ways? What ways are appropriate to my data and help answer my question?
- How might I describe the distribution/s? What language might I use to describe what I see? (Symmetric/Assymmetric (Skewed), spike, trough, etc.)
- Are there differences among distributions in terms of centre, shape and spread? Which measures of those features should I use?
- What variation can I see in my data? What might be the causes of that variation?
- Can I make preliminary statements about my findings, starting with “I noticed that...”
Conclusion
The conclusion section is about answering the question in the problem section and providing reasons based on their analysis.
- Have I answered my original question? If not, why not?
- How might I convince someone else I have answered the question?
- What displays best show what I have found out?
- Have I used displays and measures to support my ideas? Do the displays and my ideas match?
- Do I go back to the context to suggest why the patterns, differences, relationships or trends occur? (Why might carrots be crunchier than apples?0
- Do I say about the limitations of what I have found out? What can I say and what can’t I say?
Examples of work
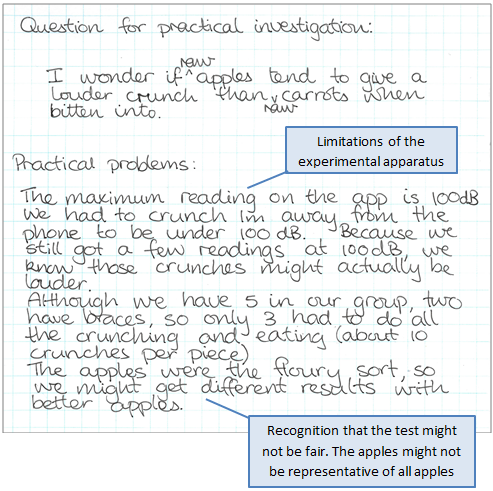
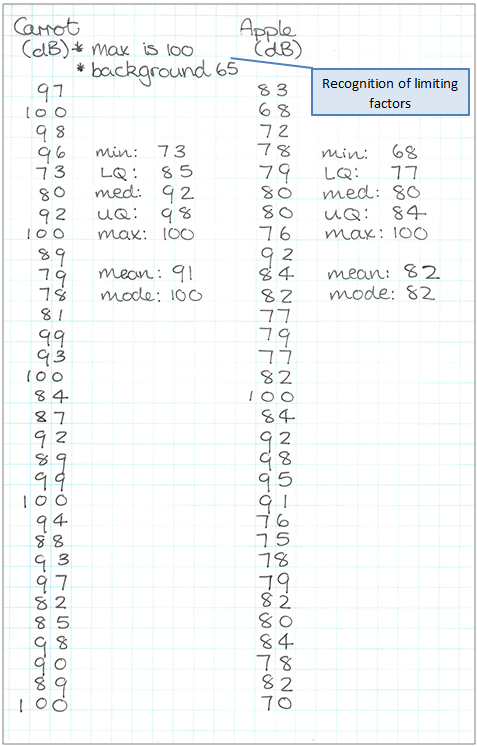
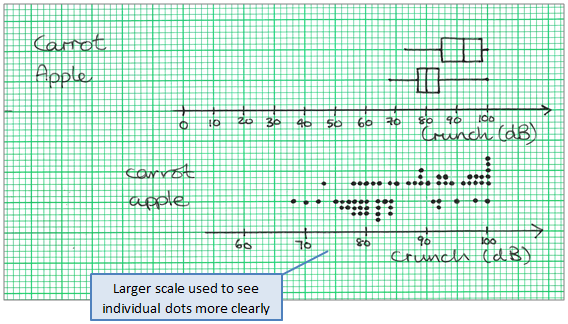
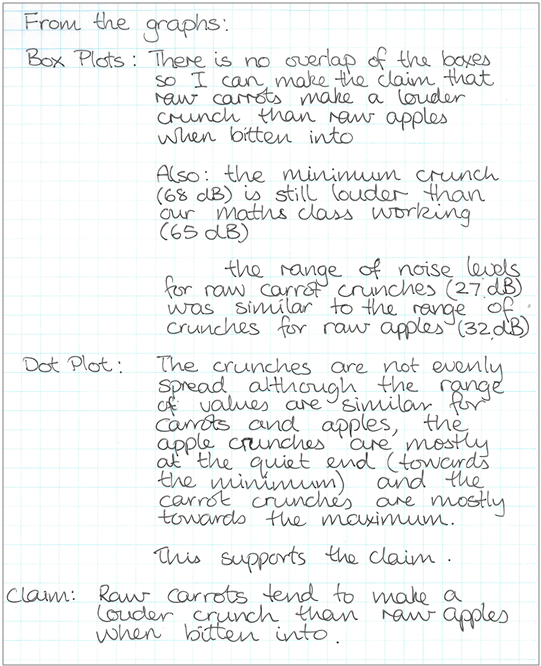
Work sample 1
- The student is able to carry out a practical statistical investigation, using the statistical enquiry cycle, following the given processes and guidelines for how to make the call.
Click on the image to enlarge it. Click again to close. 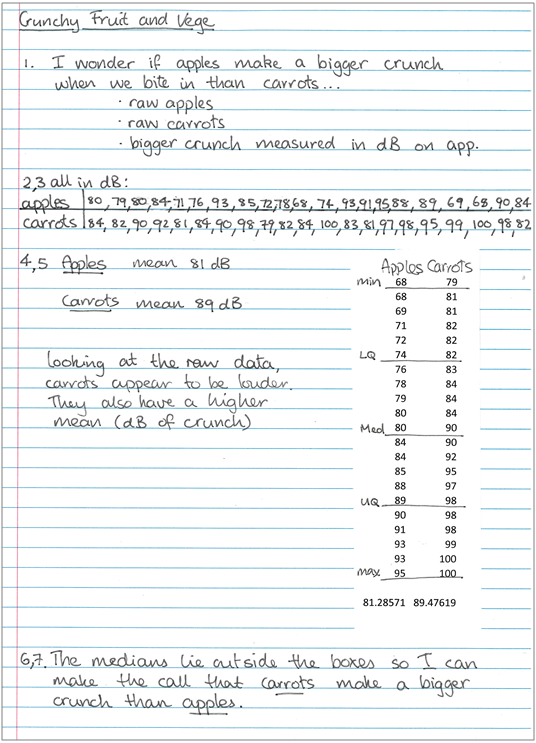
Work sample 2
- The student is able to carry out a practical statistical investigation, using the statistical enquiry cycle, following the given processes and guidelines for how to how to make the call, drawing a conclusion based on the key features of the data.
Click on the image to enlarge it. Click again to close.