The purpose of this activity is to engage students in an investigation following the statistical enquiry cycle.
This activity assumes the students have experience in the following areas:
- Posing questions for statistical enquiry.
- Calculating measures of centre and spread from numeric or measurement data.
- Graphing numeric or measurement data using dotplots (Box and Whisker graphs), stem and leaf plots, and histograms.
- Making claims based of analysis of data to answer questions.
The problem is sufficiently open ended to allow the students freedom of choice in their approach. It may be scaffolded with guidance that leads to a solution, and/or the students might be given the opportunity to solve the problem independently.
The example responses at the end of the resource give an indication of the kind of response to expect from students who approach the problem in particular ways.
 Task: After a successful 'walk and wheels' week, students suggested they would be more likely to walk or ride to school if they didn't have to carry so much in their school bags.
A PE teacher countered that argument by suggesting that if they did walk or ride, they might get fitter and stronger and so not notice the weight of their bags so much.
Does bag weight affect how students travel to school? Use the data in the sample of year 9 and 10 students from CensusAtSchool, to investigate these ideas.
The following prompts illustrate how this activity can be structured around the phases of the Statistical Enquiry Cycle.
Problem
The problem section is about what data to collect and who to collect it from and why it’s important.
- What is my investigation question? Why do I wonder about that? (Note the question is given, not posed by the studet.)
- Is my question a summary, comparison, or relationship question? (It is a comparison questions since the groups are different ways to get to school)
- What will I need to know? (Data for each student about mode of transport and bag weight.)
- What variables will be involved? (A variable is both a characteristic and a way to measure that characteristic. In this case transport mode (categoric) and bag weight in kilograms (measurement) are the variables of interest.)
Plan
The planning section is about how students will gather the data.
- How will I go about answering this question? (Sorting the bag weight data (response variable) by mode of transport (possible explanatory variable).)
- How will I find the data that I need? Is the data already available somewhere or will I need to collect it? (Data from Census at School is suggested and is readily available.)
- What type of sample will I use? Can I justify why I chose that type of sample? (A sample of at least 100 is needed so the number of students in each group is large enough to have some confidence in the results.)
- Can I predict possible answers to my question, even before I look at data? (Students might anticipate difference in bag weight by transport group before they sort the data.)
Data
The data section is concerned with how the data is managed and organised.
- What format will I use to organise my data as I gather it, or retrieve it? (Downloading the data in a CSV file allows it to be used in software such as CODAP, NZLite and NZ Grapher.)
- What digital or written tools will help my organise my data? (Consider software, as above, and pencil and paper methods)
- How will I protect the data I gather or retrieve so it is safe?
- Is some data ‘dirty’ (untrustworthy)? How will I clean my data? (Bag weights below 0.5 kgs are unrealistic. Students might also include an upper limit, such as 15 kg.)
Analysis
The analysis section is about exploring the data and reasoning with it.
- Have I reflected back on my question so I am clear what I am trying to find out?
- How can I display different sortings of my data to look for patterns, differences, relationships and trends? (Dotplots with overlaying box and whisker graphs are a good visual display of the bag weights of each group.)
- How might I describe the distribution/s? What language might I use to describe what I see? (Symmetric/Assymmetric (Skewed), spike, trough, etc.)
- Are there differences among distributions in terms of centre, shape and spread? Which measures of those features should I use? (Software provides a visual display of distributions and measures, such as averages (mean, median), quartiles, maximum and minimum.)
- What variation can I see in my data? What might be the causes of that variation?
- Can I make preliminary statements about my findings, starting with “I noticed that...”
Conclusion
The conclusion section is about answering the question in the problem section and providing reasons based on their analysis.
- Have I answered my original question? If not, why not?
- How might I convince someone else I have answered the question?
- Have I acknowledged the source of my data?
- Is my summary of findings clearly written so others can understand it?
- Have I used displays and measures to support my ideas?
- Do I go back to the context to suggest why the patterns, differences, relationships or trends occur? (Ironically students who walk or ride to school tend to have heavier bags which seems counter-intuitive.)
- Do I say about the limitations of what I have found out? What can I say and what can’t I say? (The results are for one sample of students. A different sample might give different results.)
Examples of work
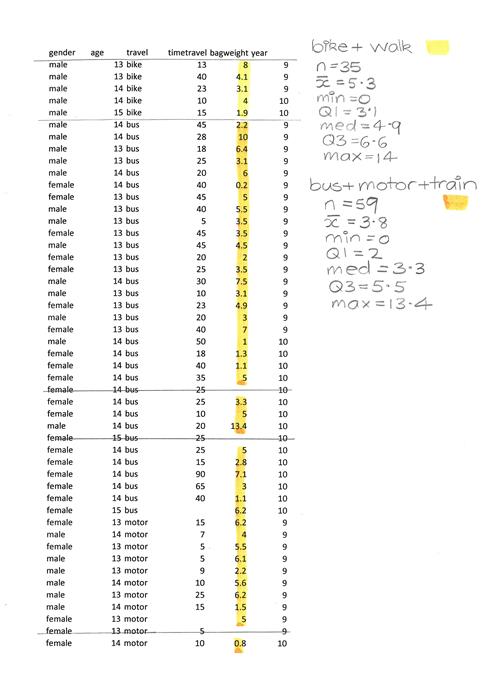
Work sample 1
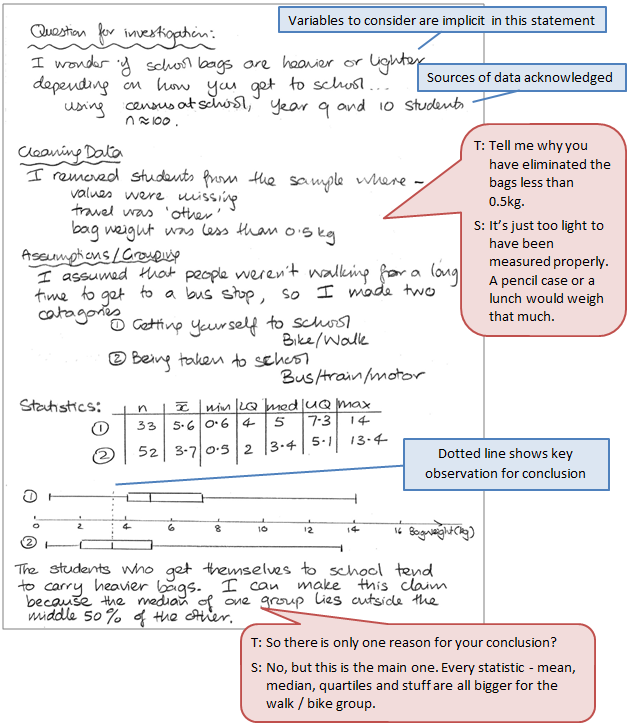
The student carries out a statistical investigation, using the statistical enquiry cycle, following the given processes and guidelines for how to make the call about differences among groups.
Click on the image to enlarge it. Click again to close. 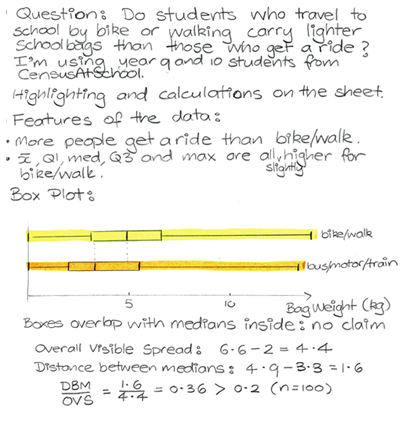

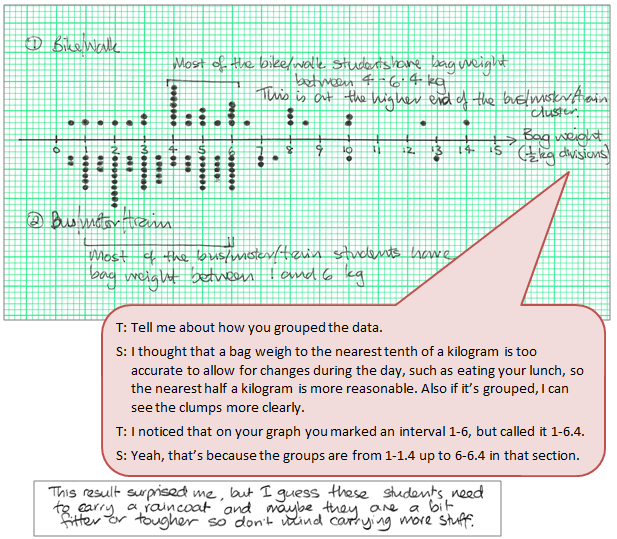
Work sample 2
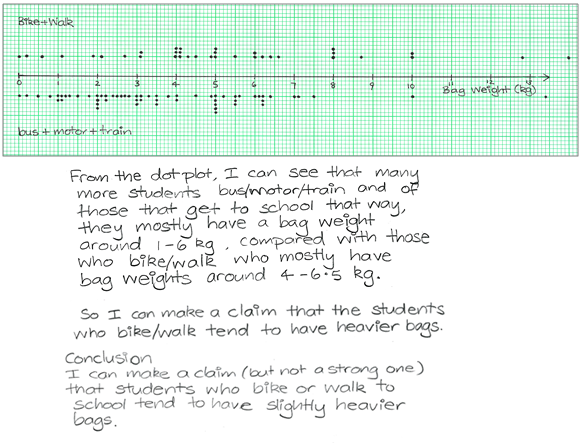
The student carries out a statistical investigation, using the statistical enquiry cycle, cleaning data as appropriate and drawing a conclusion based on the key features of the data.
Click on the image to enlarge it. Click again to close.