Connected Statistics, Level 2
City of BugsConnected Level 2, 2020: Digging Deeper |  | |
| Context | Bugs | |
| Mathematics | Statistics: The number and type of invertebrates in different areas are counted. | |
| Cross Curriculum | Science: Living World Technology | |
Sea ScienceConnected Level 2, 2019: Wild Discoveries |  | |
| Context | Marine debris | |
| Mathematics | Statistics: Data on the types of marine debris found at different locations. | |
| Cross Curriculum | Science: Nature of science | |
The War on WeedsConnected Level 2, 2018: Step by Step |  | |
| Context | Marine pollution | |
| Mathematics | Statistics: Using a database of weeds. | |
| Cross Curriculum | Science: Living World Technology | |
City of BugsConnected Level 2, 2020: Digging Deeper | | |
| Context | Bugs | |
| Mathematics | Statistics: The number and type of invertebrates in different areas are counted. | |
| Cross Curriculum | Science: Living World Technology | |
Sea ScienceConnected Level 2, 2019: Wild Discoveries | | |
| Context | Marine debris | |
| Mathematics | Statistics: Data on the types of marine debris found at different locations. | |
| Cross Curriculum | Science: Nature of science | |
The War on WeedsConnected Level 2, 2018: Step by Step | | |
| Context | Marine pollution | |
| Mathematics | Statistics: Using a database of weeds. | |
| Cross Curriculum | Science: Living World Technology | |
Why do our muscles get tired?Connected Level 2, 2015 |  | |
| Context | Investigating muscle fatigue. | |
| Mathematics | Statistics: Designing an investigation, collecting and analyzing (finger) fitness data. | |
| Cross Curriculum | Health and PE | |
Operation Duck Pond | | |
| Context | Breeding habitats for ducks. | |
| Mathematics | Statistics: Describes the process of collecting scientific data and introduces outliers. | |
| Cross Curriculum | Science | |
The Takeaway TableConnected Level 2, 2013: I Spy..., p.20 |  | |
| Context | Birds within a school environment. | |
| Mathematics | Statistical Investigations: Students undertake an investigation and collect data to inform them of the range of bird types in their school environment. This enables students to develop an appropriate bird table and feeding plan. | |
| Cross Curriculum | Science: Living World | |
Look out for MonarchsConnected Level 2, 2013: I Spy..., p.28 | | |
| Context | Monarch Butterflies. | |
| Mathematics | Statistical Investigations: Students are encouraged to gather data about tagged and numbered monarch butterflies anywhere in NZ. By becoming ‘citizen scientists’, they are helping the Monarch Butterfly New Zealand Trust. | |
| Cross Curriculum | Science: Living World | |
What’s for lunch?Connected 1, 2006, p.26 |  | |
| Context | Discussion of the food pyramid begins an investigation into the nature of the lunches of the students in one classroom. | |
| Mathematics | Statistical Investigations: Food-type data are collected using tally charts, displayed in a bar graph, and discussed. | |
| Cross Curriculum | Health and PE | |
Bat MathsConnected 1, 2002, p.24 |  | |
| Context | Information is presented about the number of bat calls recorded in two locations: above a road and through a forest. | |
| Mathematics | Statistical Literacy: The reader is prompted to consider the conclusions drawn about bat call data that are presented in a table and on a bar graph. | |
| Cross Curriculum | Science: Living World | |
How the Children of Room 3 Keep Their Clothes On.Connected 1, 1999, p.25 |  | |
| Context | Button, zips, velcro, buckles, laces and elastic help to keep our clothes on. | |
| Mathematics | Statistical Investigations: Data are collected using a tally chart, and are presented on a bar graph. | |
| Cross Curriculum | Social Sciences | |
How Much Do They Eat?Connected 1, 1998, p.32 |  | |
| Context | A comparison is made of the amount eaten by a cow, a sheep, a dog, a cat and a hen. | |
| Mathematics | Statistical Literacy: The reader interprets a bar graph showing the kilogram amounts of food eaten by selected animals, and answers questions posed. | |
| Cross Curriculum | Science: Living World | |
Connected Statistics, Level 3
Predicting PossibilitiesConnected Level 3, 2019: Shifting Views |  | |
| Context | Real world examples of predicting outcomes. | |
| Mathematics | Statistics: Investigating possible outcomes and comparing likelihoods. | |
| Cross Curriculum | N/A | |
Testing the WatersConnected Level 3, 2017: Mahi Tahi |  | |
| Context | Testing the health of waterways. | |
| Mathematics | Statistics: Interpreting data displays | |
| Cross Curriculum | Science: Living World | |
Totally Random?Connected Level 3, 2016: Picture This |  | |
| Context | Dice games. | |
| Mathematics | Statistics: Investigating probability and randomness. | |
| Cross Curriculum | N/A | |
Predicting PossibilitiesConnected Level 3, 2019: Shifting Views | | |
| Context | Real world examples of predicting outcomes. | |
| Mathematics | Statistics: Investigating possible outcomes and comparing likelihoods. | |
| Cross Curriculum | N/A | |
Testing the WatersConnected Level 3, 2017: Mahi Tahi | | |
| Context | Testing the health of waterways. | |
| Mathematics | Statistics: Interpreting data displays | |
| Cross Curriculum | Science: Living World | |
Totally Random?Connected Level 3, 2016: Picture This | | |
| Context | Dice games. | |
| Mathematics | Statistics: Investigating probability and randomness. | |
| Cross Curriculum | N/A | |
Sleep Sleuths |  | |
| Context | Investigating the amount of sleep people need to keep healthy. | |
| Mathematics | Statistics: Designing an investigation, collecting and analyzing data, drawing conclusions, and asking more questions. | |
| Cross Curriculum | Health and PE | |
Counting Kākahi |  | |
| Context | Collecting and presenting data that show freshwater mussels (kākahi) are nearly disappearing from some NZ waterways. | |
| Mathematics | Statistics: Using statistics to inform ecological decisions. | |
| Cross Curriculum | Science | |
You Can Count On ItConnected Level 3, 2013: Food for Thought, p.18 |  | |
| Context | Analysing multivariate data to predict a sports result. | |
| Mathematics | Statistical Literacy: Students, wanting to predict the results of an upcoming sports competition between year 5 and year 6 students, analyse and look for patterns in student data cards. | |
| Cross Curriculum | Health and PE | |
The Fish HighwayConnected Level 3, 2013: Food for Thought, p.23 | | |
| Context | Fish populations in Wellington’s storm water system. | |
| Mathematics | Statistical Literacy: Fish scientist, Frances, undertakes snapshot surveys of fish populations. Her data inform the New Zealand Freshwater Fish Database./td> | |
| Cross Curriculum | Science: Living World | |
Why Does It Always Rain on Me?Connected Level 3, 2012: Watching the weather, p.21 |  | |
| Context | Weather | |
| Mathematics | Statistical Literacy: Students interpret the rainfall data, bar and line graphs, and are encouraged to look for patterns in Wellington’s weather. | |
| Cross Curriculum | Science: Physical World | |
I Miss My PetConnected 2, 2006, p.3 |  | |
| Context | The death of a pet leads to an investigation into the life expectancy of the pets belonging to students in one classroom. | |
| Mathematics | Statistical Investigations: A question posed, decimal data are recorded on a spreadsheet, and displayed on a bar graph. The concepts of distribution and central tendency are explored. | |
| Cross Curriculum | Science: Living World | |
Getting the Green LightConnected 2, 2001, p.10 |  | |
| Context | Public planning organizations use statistics to help them make important decisions. | |
| Mathematics | Statistical Investigations/Literacy: Students explore the process for conducting an investigation, the sources and types of data. Readers consider who produced any set of data and for what purpose. | |
| Cross Curriculum | Social Sciences | |
Tomato: Fruit or vegetable?Connected 2, 2000, p.24 |  | |
| Context | The characteristics of tomatoes are compared with other fruit and vegetables. | |
| Mathematics | Statistical Literacy: Category data are collected and displayed in a chart that informs the conclusion that a tomato is a fruit. | |
| Cross Curriculum | Health and PE | |
Connected Statistics, Level 4
Under the SeaConnected Level 4, 2018: Digital Space |  | |
| Context | Marine life on a reef | |
| Mathematics | Statistics: Using a survey to estimate the numbers of plants and animals living on a reef. | |
| Cross Curriculum | Science: Living world Technology | |
Sensing DataConnected Level 4, 2017: Where to Next? |  | |
| Context | Air pollution | |
| Mathematics | Statistics: Interpreting data presented in a variety of ways. | |
| Cross Curriculum | Science: Nature of science Technology | |
Winning Ways: Presenting Scientific DataConnected Level 4, 2016: Getting the Message | | |
| Context | Science fair project | |
| Mathematics | Statistics: Ways to present data. | |
| Cross Curriculum | Science: Nature of science | |
The Great Marble Challenge |  | |
| Context | Making a ramp at the correct gradient such that a marble, when rolled, will travel down it and stop at a given distance. | |
| Mathematics | Measurement/Statistics: Collecting measurement data, graphing variables on a dot plot and using results to inform a successful strategy. | |
| Cross Curriculum | Science | |
Training for Success | | |
| Context | An athlete collects data to inform training and to improve performance. | |
| Mathematics | Statistics: Collecting measurements, graphing performance data, calculating means and evaluating results. | |
| Cross Curriculum | Health and PE | |
Keep your cat insideConnected Level 4, 2013: Are You Sure?, p.27 |  | |
| Context | Your cat: predator or pet? | |
| Mathematics | Statistical Literacy: Sample size, and the reliability and validity of evidence are examined within the context of two studies that gather data about the predation of domestic cats in Wellington and Dunedin. | |
| Cross Curriculum | Science: Living World | |
An Ecologist on IceConnected Level 4, 2013: Are You Sure?, p.10 | | |
| Context | Ross Sea Adélie penguin population | |
| Mathematics | Statistical Literacy: In interpreting Adélie penguin population data, the computer model explores response and predictor variables, and helps to make sense of the birds’ responses to changes in their environment. | |
| Cross Curriculum | Science: Living World | |
Power AlternativesConnected 3, 2010: Wind Power, p.24 |  | |
| Context | Identifying energy sources in NZ and their costs | |
| Mathematics | Statistical Literacy: The reader interprets a pie graph and a line graph. | |
| Cross Curriculum | Science: Physical World | |
Making Decisions with Bubble GraphsConnected 3, 2008, p.10 |  | |
| Context | Making informed choices about school playground equipment. | |
| Mathematics | Statistical Investigations/Literacy: Data on year level suitability of equipment, costs, flexibility and popularity are presented on bubble graphs and on a table. The reader interprets and compares the displays, and is asked to make a decision. | |
| Cross Curriculum | Health and PE | |
Down for the countConnected 3, 2004, p.15 |  | |
| Context | The close monitoring of the numbers of rare Māui’s dolphin is documented. | |
| Mathematics | Statistical Investigations/Literacy: Questions about the population data, the error rates, population modeling and conservation strategies, engage the reader in calculations of rates and averages. | |
| Cross Curriculum | Science: Living World | |
BeetleConnected 3, 2002, p.28 |  | |
| Context | The discovery of a huhu beetle prompts a game of beetle. | |
| Mathematics | Probability: Probability is explored in this story as the game of Beetle is played out. | |
| Cross Curriculum | Science: Living World | |
The Black Caps Make HistoryConnected 3, 2000, p.10 | 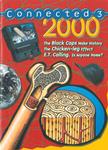 | |
| Context | The 1999 NZ men’s cricket game defeats England at Lords for the first time in history. | |
| Mathematics | Statistical Investigations: Match data are given and performance is shown in line graph and on a histogram. | |
| Cross Curriculum | Health and PE | |
In the Dark, Seeing the CluesConnected 3, 1999, p.30 |  | |
| Context | A covert operations probability problem and cracking a number code | |
| Mathematics | Probability: Using a tree diagram to solve a probability problem, and logic to solve a code problem. | |
| Cross Curriculum | N/A | |