The purpose of this unit is to develop students’ understanding that texts have different language features, depending on their purpose. Students learn about words in texts by conducting a statistical investigation, and by using their data to answer the question they pose.
- Suggest an investigative question.
- Plan and carry out an investigation. (Collect, sort and display data, communicate findings based on data and draw conclusions.)
- Sort words by category and justify their classification.
- Create a pictograph and correctly name (word) categories.
- Present pictograph data in a bar graph, showing understanding of both displays.
- Communicate findings.
- Make statements about another’s data display and findings.
The English language poses many challenges for language learners. For example, it has been calculated that, because of the exceptions, the spelling of 3700 common words must be rote-learned. As students come to understand the common word types, and begin to recognise the comparative frequency of these in different genre, they begin to see how language is shaped for different purposes.
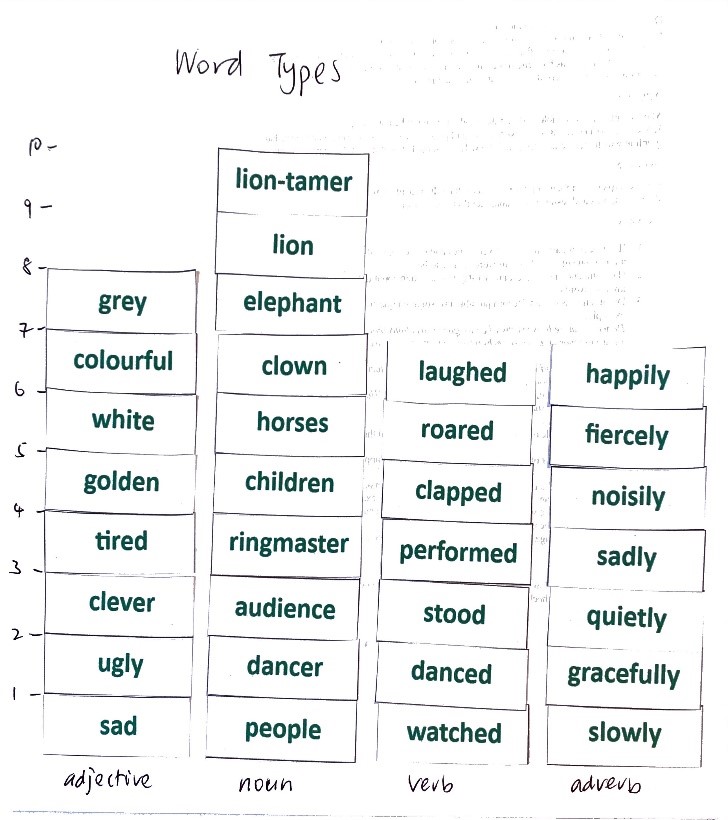
We can use a mathematical approach to assist with developing this understanding. As students participate in a simple statistical exercise of sorting words, justifying their categories, displaying these and explaining their data displays, they are consolidating their understanding of the names of the kinds of words we use and their usage. Their first display in this series of lessons is a pictograph (with a word instead of a picture). In creating this, they are reviewing display features learned in level one: The vertical axis is numbered to match the words, and the horizontal axis names the categories (nouns, adjectives, verbs, adverbs). A space is left between the categories and the graph is given a title.
Their exploration of words types can give rise to wondering statements about the way we use particular word types for different purposes and audiences. A further investigative question naturally arises from this developing awareness and leads to an investigation of word use in different genre. Students plan how they will gather data to answer their investigative question, and present this information on a bar graph. They are further developing their understanding of this display type, and its similarities and differences to the pictograph: the numbers on the vertical axis label points, not spaces, the height of the bar shows the total in the category and the columns have spaces between them because the data are discrete (note that all category data are discrete).
The student is also learning to discuss the findings, give an appropriate answer to the investigative question and suggest the effects of their findings. When students are immersed in a meaningful investigation, their findings will often generate further investigative questions, as they want to know more. This is to be supported and encouraged.
It is very important that students have opportunities to critique the data displays of others, comparing the statements that others have made about their displays with the features of the display. Beginning to develop statistical literacy, and having the disposition of questioning and critiquing, is fundamental for students who live in our data saturated world.
Associated Achievement Objectives
English
Purposes and audiences
- Recognise how texts are constructed for different purposes, audiences and situations.
Language features
- Recognise that oral, written and visual language features can be used for effect.
Structure
- Recognise an increasing range of text forms and differences between them.
- Paper
- Pencils and felt pens
- Scissors
- Rulers
- Graph paper
Whilst this unit is presented as sequence of five sessions, it is expected that any session may extend beyond one teaching period.
Session 1
This session is about classifying nouns, verbs, adjectives and adverbs, and making a pictograph and a bar graph to display data.
SLOs:
- Sort words by category and justify their classification.
- Create a pictograph and correctly name (word) categories.
- Present pictograph data in a bar graph, showing understanding of both displays.
- Communicate findings.
Activity 1
Begin by writing the letters d, o, r, s, w on the class chart. Explain that these letters together are the focus of this session. Give students a few moments to rearrange the letters. (sword, no, words, yes.)
Highlight the fact that the words we use are often taken for granted but that they are the fundamental ‘tools’ of communication.
Activity 2
- Make available to the students the range of coloured copies of Attachment 1, sufficient for each student to have one page of one of the colours.
(Each coloured sheet has a different selection of words and a different number of each word type. This is to create variety within the task and to generate useful comparative discussion).
Have each student select one sheet and cut the sheet into its 30 separate rectangular sections. - Have students sort their set of words into categories, justify their categories to a partner, and then discuss some of these as a class. (These may include word size -the number of letters in a word, initial letter, part of speech, words with/without double letters). Accept and discuss the categories.
- Guide discussion to parts of speech. Identify and discuss the word types that are included in each set (verbs, adverbs, nouns, adjectives) and write these on the class chart.
- Explain that we are going to use statistics to sort, display and discuss the set of cards we have. We are going to sort the data into categories according to the word type.
Have all students sort their set into these categories. - Have students check the categories of at least one other student with a different coloured set. Discuss and agree.
Activity 3
- Make available plain A4 paper, glue, pencils and rulers.
- Explain that each student is to create a (picto)graph by gluing their ‘data’ onto the A4 sheet. Model this as required.
- The vertical axis is numbered to match the frequency of the words, and the horizontal axis names the categories (nouns, adjectives, verbs, adverbs). A space is left between the categories and the graph is given a title.
Have students write at least two statements about their display, naming parts of speech and using comparative language (more, fewer, the same). Use the prompt “I notice…” to generate statements about displays. Encourage the use of the variable – word types – in their statements.
Activity 4
- Make graph paper available to students.
- Explain to the students that they are to use this data make a bar graph. Model this process, emphasising the features of each display that are the same (the horizontal axis names the categories (nouns, adjectives, verbs, adverbs), a space is left between the discrete data categories and the graph is given a title) and the features that are different (the numbers on the vertical axis label points, not spaces, the height of the bar shows the total in the category).
- Fully explore the similarities and difference between the two display types.
Activity 5
Have students share and discuss both of their displays, highlighting the differences between them.
Activity 6
Conclude the lesson by having students write several sentences, using words from their display. (For example: The red kite soared gracefully. Or, The rusty robot banged noisily.) Highlight that the purpose of this is to see the parts of speech ‘in action’ within a text.
Session 2
This session is about applying their knowledge of display types, considering verb types, and designing an investigative question about words.
SLOs:
- Sort words by category and justify their classification.
- Present data on a bar graph and talk findings.
- Suggest an investigative question.
- Plan an investigation.
Activity 1
Begin the session by reviewing the difference between the data displays created in Session 1.
Activity 2
Have student share some of the sentences written in Session 1, Activity 6, focusing discussion on parts of speech.
Activity 3
Distribute Attachment 2 to the students.
Have student pairs discuss the words and suggest categories for these.
As a class, discuss and agree that they are all verbs and that these are in three categories: past tense (an action that has happened) present tense (an action that is happening now) and an imperative (or bossy) verb that tells someone to act in some way.
Activity 4
Make graph paper available. Explain that students will not be cutting up Attachment 2. Rather they will be counting the word types and presenting this information on a simple bar graph in which they demonstrate their knowledge of the key features of this type of display.
Activity 5
Upon completion of their graphs, have them share their displays with a partner, checking display features and results (the graphs should be the same).
Activity 6
- Have student pairs discuss the verb types and name the kinds of texts that might use more of one of these kinds of words than another.
- Have student pairs suggest an investigative question about the way we use particular kinds of words.
- Discuss this as a class. Record possible investigation questions on the class chart. For example:
Do we use more bossy verbs when we give instructions than when we write a recount?
Do we use more past tense verbs when we write a narrative than when we write an explanation?
Do we use more adjectives when we write a narrative (story or poem) than when we write an explanation? - Choose one investigative question to explore as a class, and ask, “How can we find out the answer to our investigative question?”
Discuss and agree on the data collection method:- an example of each kind of text will be found and the words in them compared.
- the number of times the identified part of speech appears in each text, will be counted.
- because the texts may be of different lengths, to make the investigation fair, the same amount of text should be compared. For example, a total of 100 consecutive words from each kind of text will be analysed.
- data will be presented in a display (bar graph).
- the investigative question will be answered, shared and discussed.
Activity 7
Conclude the session by having students identify texts (within School Journals, from book in the library corner etc.), check these out and make predictions.
Session 3
This session is about carrying out an investigation into words in texts, and presenting findings.
SLOs:
- Collect data.
- Sort data.
- Display data.
Activity 1
Review the investigation plan designed in Session 2.
Activity 2
Distribute a copy of Attachment 3 (or of chosen texts) to each student.
Read and enjoy each text together. Identify the genre of each: explanation (recipe) and narrative (ballad). Discuss.
Identify the word type (for example, the ‘bossy’ verb, or the verb in the past tense or the adjective) and locate examples of this within each of the texts.
Activity 3
- Agree together on the number of consecutive text words that will be analysed: For example 100.
Recognise that it would make the investigation more valid if people began their analysis in different places within each text. - Have students identify and mark the place they are beginning their analysis, count the next 100 consecutive words and mark the finishing place.
- Make highlighter pens available.
Have each student highlight the identified word type each time it appears in each text. For example, highlight an imperative (‘bossy’) verb each time it appears. - Make graph paper available.
Have students count their highlighted words, record these numbers, and display these data on a bar graph. Remind students that they will need to consider the title, axis labels and scale.
Activity 4
- Have students pair share their displays, discuss the similarities (same trend) and differences (number differences, depending on which section of the text they chose to analyse), and evaluate the process.
- Refer to the investigative question and have students write their answer to accompany their graph.
Activity 5
Conclude the session by discussing and evaluating the investigation process and record on the class chart any suggestions for changes that could/should be made in the future.
Session 4
This session is about students asking their own investigative question about the format and language of text types, planning and carrying out an investigation and displaying their findings.
SLOs:
- Communicate findings based on data.
- Draw conclusions.
- Plan and carry out an investigation.
Activity 1
Have students share their data displays and their answers to the class investigative question. Discuss reasons for their results with reference to the purpose of the text and the desired effect upon the audience.
Activity 2
Suggest that this class investigation may have prompted ideas for students to conduct a text investigation of their own. Give students time to discuss and consider this then record ideas on the class chart. These could include investigating the same word type but in different genre, a different word type in at least two genre, sentence length, the number of conjunctions (for example, explore the frequency of the word ‘and’).
Activity 3
Have students choose to work alone or with a partner to write an investigative question and carry out their investigation.
Have student understand that they will be critiquing each other’s data displays and their answers to their questions.
Activity 4
Allow time for students to plan their investigation and select their texts.
Suggest that they could analyse their own writing in two different genre.
Make it clear that book texts should not be marked with highlighter and that pencils should be used.
Activity 5
Students complete their investigations during the remainder of the session.
Session 5
This session is about students carrying out a guided critique of other students' data displays.
SLOs:
- Communicate the finding of their investigation.
- Make statements about another’s data display and findings.
Activity 1
Begin by having the students pair share their investigation process and results from Session 4.
Activity 2
Make paper and pencils available.
Have each student write a brief critique of another student’s data display and findings, using these interrogative questions as a guide:
- Was the investigation process carried out correctly? How do you know?
- Does the data display show the results clearly?
- Do the category names make sense?
- Is the numbering sensible and correct?
- Does the title make sense?
- Can I believe the results? (Why/why not)
- Are there any suggestions you can make to improve the investigation?
- Are there any suggestions you can make to improve the data display?
Activity 3
- Have some students offer to read to the class the critique that their buddy has written for them.
- Write on the class chart. “We can always believe what a graph and the results tell us.”
Have student pairs discuss the statement and decide whether and why they agree or disagree. - Have student take a physical position on the class mat. Agree on one side and disagree on the other. Have students justify their position.
Activity 4
Conclude the session by reviewing key learning about how texts are constructed for different purposes, audiences and situations, and their learning about the statistical investigation cycle and how it is important to look closely at the data displays and findings of others to check that they make sense.
Dear parents and whānau,
In maths this week we have been investigating different texts, by carrying out an investigation into the numbers of certain kinds of words we use in different kinds of texts.
Discuss with your child their investigation findings and have them show you how to carry out a statistical investigation of two texts that you have at home. Your child will be keen to teach you.
Thank you for your interest.
We would welcome your visit to our classroom to see the display of our investigation results. We have learned that English helps us with mathematics, and mathematics helps us with English!