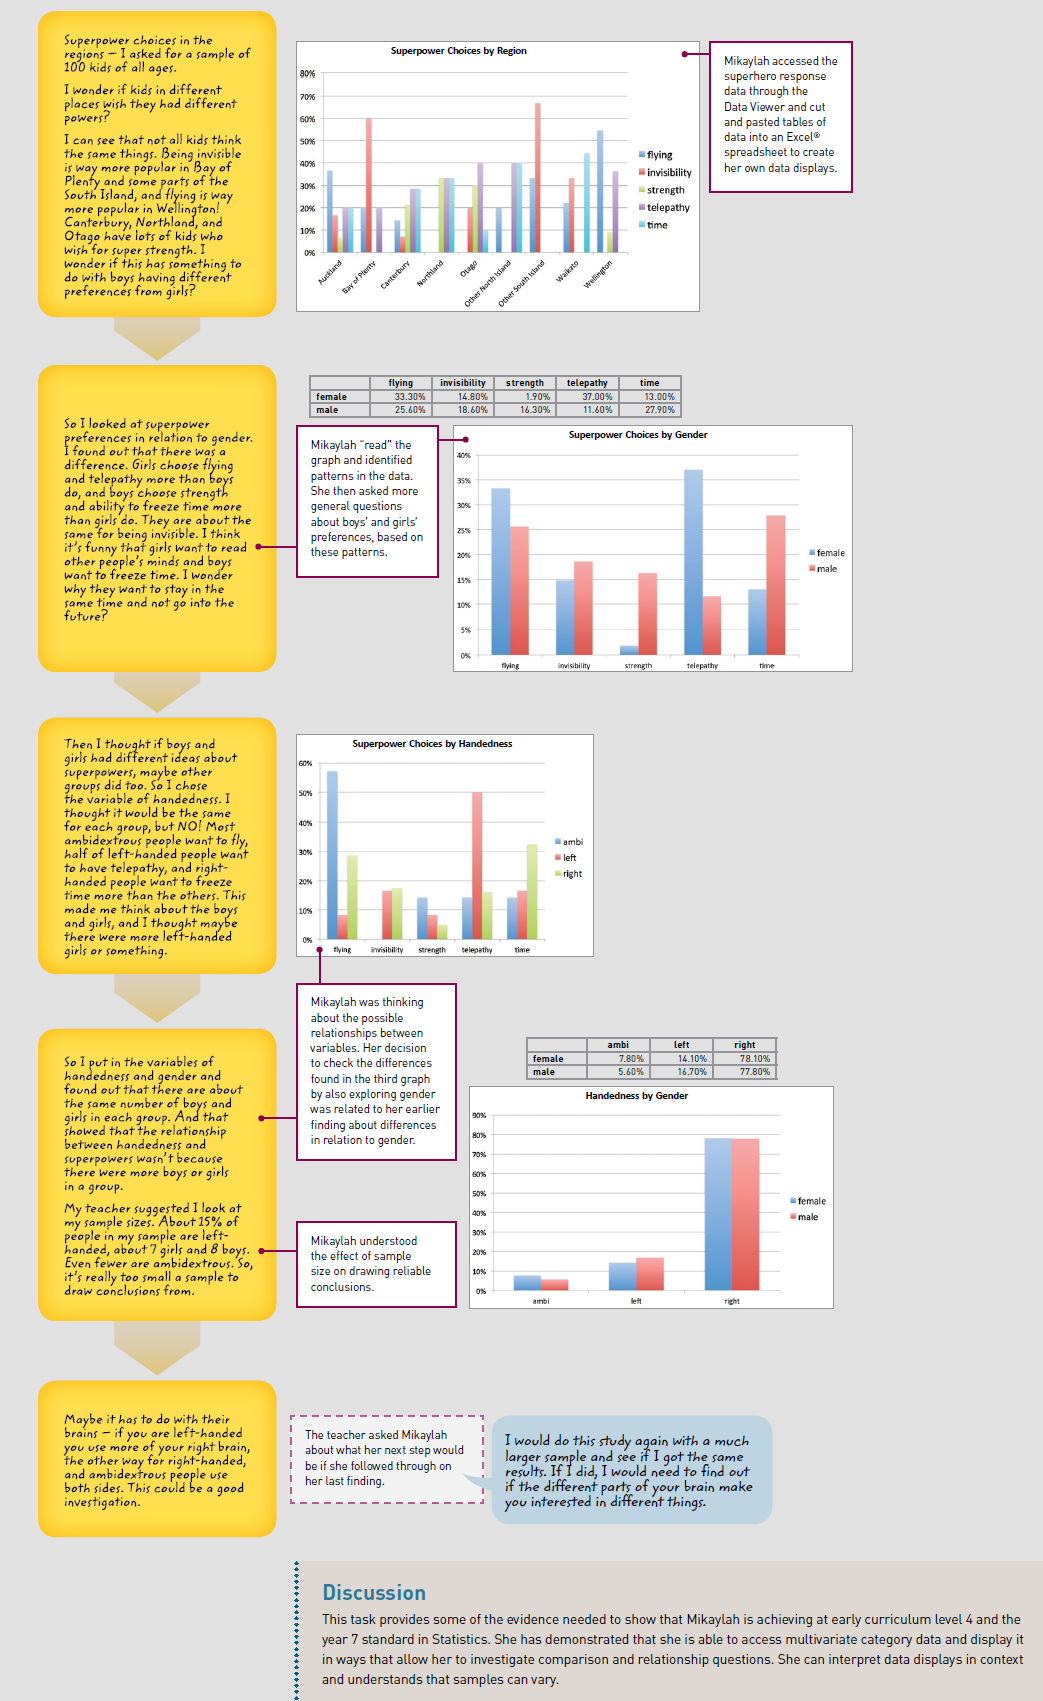
The task used in this illustration was linked to an English unit on the literary convention of the “superhero” in film and literature. The class had investigated the characteristics of superheroes and their various powers. The teacher then connected this work to the 2009 Census at School question “Which superpower would you most like to have?” The multichoice responses included: invisibility, flying ability, telepathy, ability to freeze time, or super strength. Data was available through the Census at School website, and the students were familiar with the Data Viewer tool: www.censusatschool.org.nz/2010/data-viewer
The task relates to achievement objectives for Statistics from the mathematics and statistics learning area in The New Zealand Curriculum.
The Task
Superhero Statistics
Using the Data Viewer on the Census at Schools website, explore at least two variables within the Superpower response data. Keep track of your investigation on an Excel® spreadsheet by inserting a text pane or text boxes as you create tables and graphs. It must be clear to a reader how you followed a question through the data and what conclusion you reached from your analysis of the information in the tables and graphs.

Some features of students’ work used to make judgments in relation to the mathematics standards are described below. There is also an illustration of the year 8 standard for this task.
| New Zealand Curriculum: Level 4 | National Standards: By the end of year 7 |
| In solving problems and modelling situations, students will: | |
|
Statistics
|
Statistics
|
Hover over the image to zoom a section. Click on the image to enlarge it. Click again to close.
PDF of this task and Illustrations of the year 7 and 8 standards (5.55MB)