Illustrating the Mathematics Standards

The Ministry is migrating nzmaths content to Tāhurangi.           
Relevant and up-to-date teaching resources are being moved to Tāhūrangi (tahurangi.education.govt.nz). 
When all identified resources have been successfully moved, this website will close. We expect this to be in June 2024. 
e-ako maths, e-ako Pāngarau, and e-ako PLD 360 will continue to be available. 

For more information visit https://tahurangi.education.govt.nz/updates-to-nzmaths

image map.

Year 1Year 2Year 3Year 4Year 5Year 6Year 7Year 8

The following examples of student work illustrate achievement at the mathematics standard for year 5.


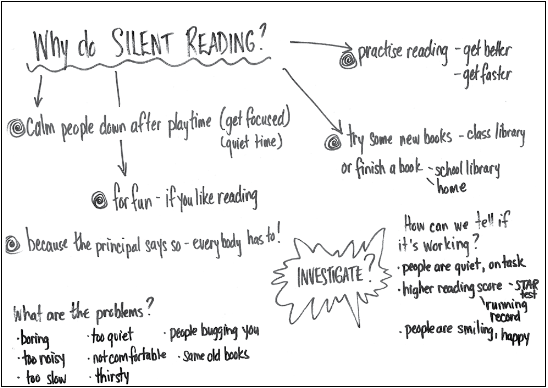
The task used in this illustration was part of an investigation into reading behaviour in a year 5–6 class. The teacher scheduled a 30-minute silent reading time after lunch each day. When the class repeatedly struggled to settle, one boy asked: “Why do we have silent reading anyway?” The teacher opened a discussion of this question, seeing the potential for a statistical investigation.

The task relates to achievement objectives for Statistics from the mathematics and statistics learning area in The New Zealand Curriculum.

The Task

Silent Reading

Identify and investigate a question that will help us understand more about silent reading in our class.

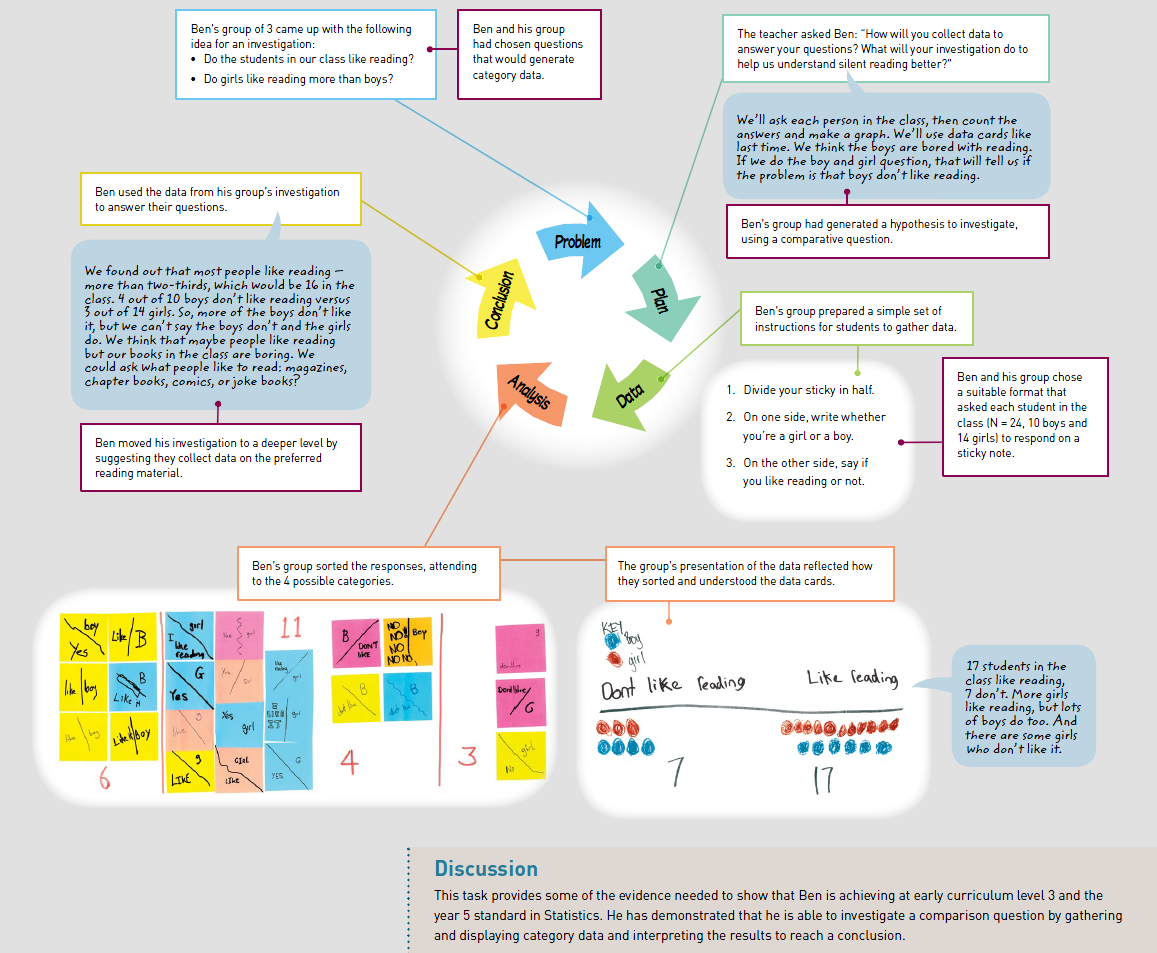
Some features of students’ work used to make judgments in relation to the mathematics standards are described below. There is also an illustration of the year 6 standard for this task.

New Zealand Curriculum: Level 3 National Standards: By the end of year 5
In solving problems and modelling situations, students will:
Statistics
  • conduct investigations using the statistical enquiry cycle:
    - gathering, sorting, and displaying multivariate category and whole-number data and simple time-series data to answer questions
    - identifying patterns and trends in context, within and between data sets
    - communicating findings, using data displays (statistical investigation)
Statistics
    • investigate summary and comparison questions by using the statistical enquiry cycle:
      - gather, display, and identify patterns in category and wholenumber data
      - interpret results in context

Hover over the image to zoom a section.  Click on the image to enlarge it. Click again to close.

PDF of this task and Illustrations of the year 5 and 6 standards (1.52MB)