Under the SeaConnected Level 4, 2018: Digital Space | 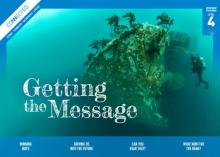 | |
| Context | Marine life on a reef | |
| Mathematics | Statistics: Using a survey to estimate the numbers of plants and animals living on a reef. | |
| Cross Curriculum | Science: Living world Technology | |
Sensing DataConnected Level 4, 2017: Where to Next? | 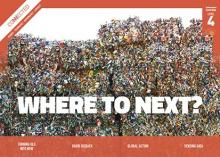 | |
| Context | Air pollution | |
| Mathematics | Statistics: Interpreting data presented in a variety of ways. | |
| Cross Curriculum | Science: Nature of science Technology | |
Winning Ways: Presenting Scientific DataConnected Level 4, 2016: Getting the Message |  | |
| Context | Science fair project | |
| Mathematics | Statistics: Ways to present data. | |
| Cross Curriculum | Science: Nature of science | |
The Great Marble Challenge | 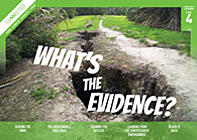 | |
| Context | Making a ramp at the correct gradient such that a marble, when rolled, will travel down it and stop at a given distance. | |
| Mathematics | Measurement/Statistics: Collecting measurement data, graphing variables on a dot plot and using results to inform a successful strategy. | |
| Cross Curriculum | Science | |
Training for Success |  | |
| Context | An athlete collects data to inform training and to improve performance. | |
| Mathematics | Statistics: Collecting measurements, graphing performance data, calculating means and evaluating results. | |
| Cross Curriculum | Health and PE | |
Keep your cat insideConnected Level 4, 2013: Are You Sure?, p.27 |  | |
| Context | Your cat: predator or pet? | |
| Mathematics | Statistical Literacy: Sample size, and the reliability and validity of evidence are examined within the context of two studies that gather data about the predation of domestic cats in Wellington and Dunedin. | |
| Cross Curriculum | Science: Living World | |
An Ecologist on IceConnected Level 4, 2013: Are You Sure?, p.10 |  | |
| Context | Ross Sea Adélie penguin population | |
| Mathematics | Statistical Literacy: In interpreting Adélie penguin population data, the computer model explores response and predictor variables, and helps to make sense of the birds’ responses to changes in their environment. | |
| Cross Curriculum | Science: Living World | |
Power AlternativesConnected 3, 2010: Wind Power, p.24 |  | |
| Context | Identifying energy sources in NZ and their costs | |
| Mathematics | Statistical Literacy: The reader interprets a pie graph and a line graph. | |
| Cross Curriculum | Science: Physical World | |
Making Decisions with Bubble GraphsConnected 3, 2008, p.10 |  | |
| Context | Making informed choices about school playground equipment. | |
| Mathematics | Statistical Investigations/Literacy: Data on year level suitability of equipment, costs, flexibility and popularity are presented on bubble graphs and on a table. The reader interprets and compares the displays, and is asked to make a decision. | |
| Cross Curriculum | Health and PE | |
Down for the countConnected 3, 2004, p.15 | 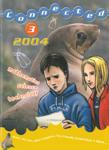 | |
| Context | The close monitoring of the numbers of rare Māui’s dolphin is documented. | |
| Mathematics | Statistical Investigations/Literacy: Questions about the population data, the error rates, population modeling and conservation strategies, engage the reader in calculations of rates and averages. | |
| Cross Curriculum | Science: Living World | |
BeetleConnected 3, 2002, p.28 | 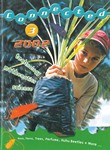 | |
| Context | The discovery of a huhu beetle prompts a game of beetle. | |
| Mathematics | Probability: Probability is explored in this story as the game of Beetle is played out. | |
| Cross Curriculum | Science: Living World | |
The Black Caps Make HistoryConnected 3, 2000, p.10 |  | |
| Context | The 1999 NZ men’s cricket game defeats England at Lords for the first time in history. | |
| Mathematics | Statistical Investigations: Match data are given and performance is shown in line graph and on a histogram. | |
| Cross Curriculum | Health and PE | |
In the Dark, Seeing the CluesConnected 3, 1999, p.30 | 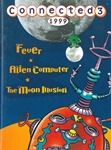 | |
| Context | A covert operations probability problem and cracking a number code | |
| Mathematics | Probability: Using a tree diagram to solve a probability problem, and logic to solve a code problem. | |
| Cross Curriculum | N/A | |
Thanks for visiting NZMaths.
We are preparing to close this site and currently expect this to be in June 2024
but we are reviewing this timing due to the large volume of content to move and
improvements needed to make it easier to find different types of content on
Tāhūrangi.
We will update this message again shortly.
For more information visit https://tahurangi.education.govt.nz/updates-to-nzmaths