City of BugsConnected Level 2, 2020: Digging Deeper | 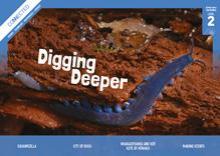 | |
| Context | Bugs | |
| Mathematics | Statistics: The number and type of invertebrates in different areas are counted. | |
| Cross Curriculum | Science: Living World Technology | |
Sea ScienceConnected Level 2, 2019: Wild Discoveries | 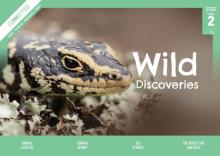 | |
| Context | Marine debris | |
| Mathematics | Statistics: Data on the types of marine debris found at different locations. | |
| Cross Curriculum | Science: Nature of science | |
The War on WeedsConnected Level 2, 2018: Step by Step | 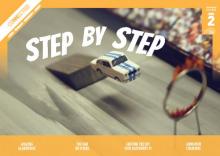 | |
| Context | Marine pollution | |
| Mathematics | Statistics: Using a database of weeds. | |
| Cross Curriculum | Science: Living World Technology | |
Why do our muscles get tired?Connected Level 2, 2015 |  | |
| Context | Investigating muscle fatigue. | |
| Mathematics | Statistics: Designing an investigation, collecting and analyzing (finger) fitness data. | |
| Cross Curriculum | Health and PE | |
Operation Duck Pond | | |
| Context | Breeding habitats for ducks. | |
| Mathematics | Statistics: Describes the process of collecting scientific data and introduces outliers. | |
| Cross Curriculum | Science | |
The Takeaway TableConnected Level 2, 2013: I Spy..., p.20 |  | |
| Context | Birds within a school environment. | |
| Mathematics | Statistical Investigations: Students undertake an investigation and collect data to inform them of the range of bird types in their school environment. This enables students to develop an appropriate bird table and feeding plan. | |
| Cross Curriculum | Science: Living World | |
Look out for MonarchsConnected Level 2, 2013: I Spy..., p.28 | | |
| Context | Monarch Butterflies. | |
| Mathematics | Statistical Investigations: Students are encouraged to gather data about tagged and numbered monarch butterflies anywhere in NZ. By becoming ‘citizen scientists’, they are helping the Monarch Butterfly New Zealand Trust. | |
| Cross Curriculum | Science: Living World | |
What’s for lunch?Connected 1, 2006, p.26 |  | |
| Context | Discussion of the food pyramid begins an investigation into the nature of the lunches of the students in one classroom. | |
| Mathematics | Statistical Investigations: Food-type data are collected using tally charts, displayed in a bar graph, and discussed. | |
| Cross Curriculum | Health and PE | |
Bat MathsConnected 1, 2002, p.24 |  | |
| Context | Information is presented about the number of bat calls recorded in two locations: above a road and through a forest. | |
| Mathematics | Statistical Literacy: The reader is prompted to consider the conclusions drawn about bat call data that are presented in a table and on a bar graph. | |
| Cross Curriculum | Science: Living World | |
How the Children of Room 3 Keep Their Clothes On.Connected 1, 1999, p.25 |  | |
| Context | Button, zips, velcro, buckles, laces and elastic help to keep our clothes on. | |
| Mathematics | Statistical Investigations: Data are collected using a tally chart, and are presented on a bar graph. | |
| Cross Curriculum | Social Sciences | |
How Much Do They Eat?Connected 1, 1998, p.32 |  | |
| Context | A comparison is made of the amount eaten by a cow, a sheep, a dog, a cat and a hen. | |
| Mathematics | Statistical Literacy: The reader interprets a bar graph showing the kilogram amounts of food eaten by selected animals, and answers questions posed. | |
| Cross Curriculum | Science: Living World | |
The Ministry is migrating nzmaths content to Tāhurangi.
Relevant and up-to-date teaching resources are being moved to Tāhūrangi (tahurangi.education.govt.nz).
When all identified resources have been successfully moved, this website will close. We expect this to be in June 2024.
e-ako maths, e-ako Pāngarau, and e-ako PLD 360 will continue to be available.
For more information visit https://tahurangi.education.govt.nz/updates-to-nzmaths