Picture graph

The Ministry is migrating nzmaths content to Tāhurangi.           
Relevant and up-to-date teaching resources are being moved to Tāhūrangi (tahurangi.education.govt.nz). 
When all identified resources have been successfully moved, this website will close. We expect this to be in June 2024. 
e-ako maths, e-ako Pāngarau, and e-ako PLD 360 will continue to be available. 

For more information visit https://tahurangi.education.govt.nz/updates-to-nzmaths
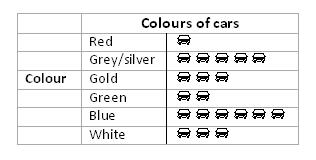
A graph for displaying the distribution of a category variable or a whole-number variable that uses pictures or symbols to represent the frequency of each category or value.

Picture graphs are useful for showing differences in frequency.

Example

A student collected data on the colour of cars that drove past her house and displayed the results on the picture graph below.


Alternative: pictogram, pictograph

Curriculum achievement objectives references
Statistical investigation: Levels (2), (3), (4), (5)