Moving mean

Thanks for visiting NZMaths.
We are preparing to close this site by the end of August 2024. Maths content is still being migrated onto Tāhūrangi, and we will be progressively making enhancements to Tāhūrangi to improve the findability and presentation of content.
 

For more information visit https://tahurangi.education.govt.nz/updates-to-nzmaths
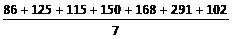
A specified moving average method used to smooth time-series data. It forms a new smoothed series in which the irregular component is reduced.

If the time series has a seasonal component a moving mean may be used to eliminate the seasonal component.

Each value in the time series is replaced by the mean of the value and a number of neighbouring values. The number of values used to calculate a moving mean depends on the type of time-series data. For weekly data, seven values are used; for monthly data, 12 values are used; and for quarterly data, four values are used. If the number of values used is even, the moving mean must be centred by taking two-term moving means of each pair of consecutive moving means, forming a series of centred moving means. See Example 2 for an illustration of this technique.

In terms of an additive model for time-series data, Y = T + S + C + I, where

        T represents the trend component,

        S represents the seasonal component,

       C represents the cyclical component, and

        I represents the irregular component;

the smoothed series = T + C.


Example 1 (Weekly data)

Daily sales, in thousands of dollars, for a hardware store were recorded for 21 days. There is reasonably systematic variation over each 7-day period and so moving means of order 7 have been calculated to attempt to eliminate this seasonal component. The moving mean for the first Thursday is calculated by   =148.14


Day Sales

($000)
Moving mean

($000)
Mon

Tue

Wed

Thu

Fri

Sat

Sun

Mon

Tue

Wed

Thu

Fri

Sat

Sun

Mon

Tue

Wed

Thu

Fri

Sat

Sun
86

125

115

150

168

291

102

83

118

112

141

171

282

99

82

117

108

155

165

271

88
148.14

147.71

146.71

146.29

145.00

145.43

144.14

143.71

143.57

143.43

142.86

144.86

144.00

142.43

140.86


The raw data and the moving means are displayed below.


Example 2 (Quarterly data)

Statistics New Zealand’s Economic Survey of Manufacturing provided the following data on actual operating income for the manufacturing sector in New Zealand. There is reasonably systematic variation over each 4-quarter period and so moving means of order 4 have been calculated to attempt to eliminate this seasonal component. However these moving means do not align with the quarters; the moving means are not centred. To align the moving means with the quarters, each pair of moving means is averaged to form centred moving means.

The first moving mean (between Mar-05 and Dec-05) is calculated by

  = 17531

The centred moving mean for Sep-05 is calculated by   = 17548.25


Quarter Operating

Income

($millions)
Moving

mean

($millions)
Centred

moving mean

($millions)
Mar-05


Jun-05


Sep-05


Dec-05


Mar-06


Jun-06


Sep-06


Dec-06


Mar-07


Jun-07


Sep-07


Dec-07
17322


17696


17060


18046


17460


19034


18245


18866


18174


19464


18633


20616


17531.00


17565.50


17900.00


18196.25


18401.25


18579.75


18687.25


18784.25


19221.75


17548.250


17732.750


18048.125


18298.750


18490.500


18633.500


18735.750


19003.000


The raw data and the centred moving means are displayed below. Note that M, J, S and D indicate quarter years ending in March, June, September and December respectively.

See: moving average

Curriculum achievement objectives reference

Statistical investigation: (Level 8)