Line graph

Thanks for visiting NZMaths.
We are preparing to close this site and currently expect this to be in June 2024
but we are reviewing this timing due to the large volume of content to move and
improvements needed to make it easier to find different types of content on
Tāhūrangi. We will update this message again shortly.

For more information visit https://tahurangi.education.govt.nz/updates-to-nzmaths
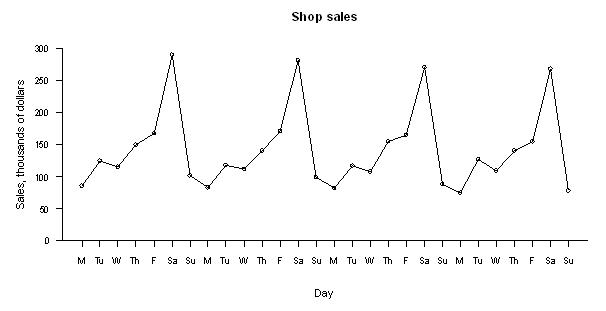
A graph, often used for displaying time-series data, in which a series of points representing individual observations are connected by line segments.

Line graphs are useful for showing changes in a variable over time.

Example

Daily sales, in thousands of dollars, for a hardware store were recorded for 28 days. These data are displayed on the line graph below.


Curriculum achievement objectives references


Statistical investigation: Levels (3), (4), (5), (6), (7), (8)