Histogram

Thanks for visiting NZMaths.
We are preparing to close this site and currently expect this to be in June 2024
but we are reviewing this timing due to the large volume of content to move and
improvements needed to make it easier to find different types of content on
Tāhūrangi. We will update this message again shortly.

For more information visit https://tahurangi.education.govt.nz/updates-to-nzmaths
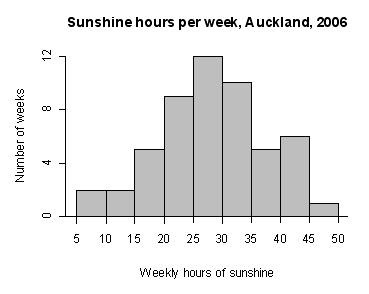
A graph for displaying the distribution of a measurement variable consisting of vertical rectangles, drawn for each class interval, whose area represents the relative frequency for values in that class interval.

To aid interpretation, it is desirable to have equal-width class intervals so that the height of each rectangle represents the frequency (or relative frequency) for values in each class interval.

Histograms are particularly useful when the number of values to be plotted is large.


Example

The number of hours of sunshine per week in Grey Lynn, Auckland, from Monday 2 January 2006 to Sunday 31 December 2006 is displayed in the histogram below.


Curriculum achievement objectives references

Statistical investigation: Levels (4), (5), (6), (7), (8)