‘Fractions as measures’ is arguably the most important of the five sub-constructs of rational number (Kieren, 1994) since it represents fractions as numbers, and is the basis of the number line. Fractions are needed when ones (wholes) are inadequate for a given purpose (e.g. division). In measurement, lengths are defined by referring to some unit that is named as one. When the size of another length cannot be accurately measured by a whole number of ones then fractions are needed.
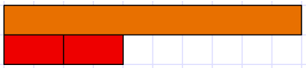
For example, consider the relationship between the brown and orange Cuisenaire rods. If the orange rod is defined as one (an arbitrary decision) then what number do we assign to the brown rod?
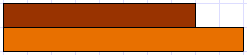
Some equal partitioning of the one is needed to create unit fractions with one as the numerator. For the size of the brown rod to be named accurately those unit fractions need to fit into it exactly. We could choose to divide the orange rod into tenths (white rods) or fifths (red rods), either would work. By aligning the unit fractions we can see that the brown rod is eight tenths, or four fifths, of the orange rod.
Note that eight tenths and four fifths are equivalent fractions and that equality can be written as 8/10 = 4/5. These fractions are different names for the same quantity and share the same point on a number line. This idea, that any given point on the number line has an infinite number of fraction names, is a significant conceptual change compared to understanding of whole numbers. Some names are more privileged than others by our conventions. In the case of four fifths, naming it as eight tenths aligns to its decimal (0.8), and naming it as eighty hundredths aligns to its percentage (80/100 = 80%).
‘Fractions as operators’ is another of Kieren’s sub-constructs and applies to situations in which a fraction acts on another amount. Some examples are:
- that amount might be a whole number, e.g. three quarters of 48
- a decimal or percentage, e.g. one half of 10% is 5%
- or another fraction, e.g. two thirds of three quarters.
A confusion students sometimes have is when fractions should be treated as numbers and when they should be treated as operators. A particular case us when creating numbers lines, e.g. they often place 1/2 where 2 1/2 belongs on a zero to five number line.
Specific Teaching Points
Understanding that fractions are always named with reference to a one (whole) requires flexible thinking. Lamon (2007) described re-unitising and norming as two essential capabilities if students are to master fractions. By re-unitising she meant that students could flexibly define a given quantity in multiple ways by changing the units they attended to. "Norming" is the process of operating with new units. In this unit Cuisenaire rods are used to develop students’ skills in changing units and thinking with those units.
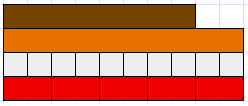
Multiplication of fractions involves adaptation of multiplication with whole numbers. Connecting 'a x b' as ‘a sets of b’ (or vice versa) with a/b x c/d as ‘a b-ths of c/d’ requires students to firstly create a referent whole. That whole might be continuous, like a region or volume, or discrete like a set. Expressing both fractions in a multiplication and the answer requires thinking in different units. Consider two thirds of one half (2/3 x 1/2) as modelled with Cuisenaire rods.
Let the dark green rod be one, then the light green rod is one half.
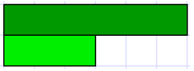
So which rod is two thirds of one half? A white rod is one third of light green so the red rod must be two thirds. Notice how we are describing the red rod with reference to the light green rod.
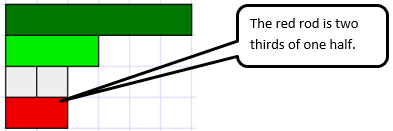
But what do we call the red rod? To name it we need to return to the original one; the dark green rod. The white rod is one sixth so the red rod is two sixths or one third of the original one. So the answer to the multiplication is 2/3 x 1/2 = 2/6 or 1/3.
Reunitising and norming are important when fractions are placed in order of size (magnitude). This is especially true given any fraction has an infinite number of names. Imagine we use the orange rod as one this time and find two fifths. Since five red rods measure one whole (orange rod) then two red rods measure two fifths:
But, what other names does two fifths have? If the red rods were split in half they would be the length of white rods and be called tenths since ten of them would form one. The crimson rod is equal to four white rods which is a way to show that 2/5 = 4/10.
If the red rods were split into three equal parts the new rods would be called fifteenths since 15 of them would form one. The crimson rod would be equal to six of these rods which is a way to show 2/5 = 6/15. The process of splitting the unit fraction, fifths in this case, into equal smaller unit fractions, is infinite. This means that the point on the number line where two fifths exist has an infinite set of number names.

Figure me out
This unit is designed to engage your class for at least the first week of the school year. It provides students an opportunity to work collaboratively and independently on challenging mathematical tasks. It also provides you, their teacher, with opportunities for you to learn about their current level of achievement.
The mathematics in the unit is varied. However, there is a general requirement for students to think multiplicatively rather than additively. The shift from additive thinking to integration of additive and multiplicative thinking is an essential requirement at Level 4. Indicators of multiplicative thinking are:
12 + 7 x 16 - 20 = 12 + 112 – 20 = 104
Specific Teaching Points
Most of the tasks are open ended so students can operate at a level that suits them. Encourage students to experiment with expressions as much as possible rather than operate ‘in the known’.
Also encourage students to work in systematic ways. To identify an unknown student which clues will be most useful? Why?
How will students check to see that they have identified the correct student? What will they do when several students have similar data?
This unit is set for students to learn, and practice, outcomes at Level 4 of mathematics in the New Zealand Curriculum. All tasks can be altered to cater for the range of readiness and interests of students in your class. A main purpose of the unit, for all students in the class, is to engage in collaborative inquiry. Many suggestions are given with specific sessions about how to simplify or add more challenge to the tasks. Most activities are open ended so students can engage at a level that is appropriate to their knowledge and interests. Other methods of enabling participation are:
The difficulty of tasks can be varied in many ways including:
The contexts for this unit can be adapted to suit the interests and cultural backgrounds of your students. In this unit students investigate data about other students in the class, and present that data in informative ways. Students may be interested in other inquiry questions. Examples might include search for the ‘average’ student in the class through investigating:
Te reo Maori vocabulary terms such as tau waenga (median), tau tānui (mode) toharite (mean), raraunga (data) and kauwhata (graph) could be introduced in this unit and used throughout other mathematical learning.
Prior Experience
Use the sessions to informally assess students' mathematical skills and understanding at the start of the school year.
Session One
For your gender, you might put male or female. Look at the poster template which has a key; If a prime then male, if a multiple of three then female.
Some students may know what prime numbers are. You may need to research primes to find they are whole numbers with only two factors, one and themselves. Is a person that puts 51 male or female?
Let the students work in pairs to establish if the person is male or female. 47 is prime so the person is male.
However, on their poster a person might write one of the following:
What is 10 x 10 000? (100 000)? So what is 12 x 10 000? (120 000)
What does 3332 mean? (333 x 333 or two 333’s multiplied together) You may need to show simpler examples of exponents like 42, 53 and 24.
What does 9! Mean? (9 factorial which is the product of 1 x 2 x 3 x 4 x 5 x 6 x 7 x 8 x 9)
A classmate gives you this clue for their date of birth. Use your calculator and research skills to find their DoB.
310 + 76 – (2 x 55) + 43 (59049 + 117 649 – 6250 + 64 = 170512)
Session Two
In this session students develop two more expressions for the number of people that normally live in their household and the distance of their home from school.
Number of People per Household
What might the graph be about? Can we give the graph a title and some labels?
The term average refers to some measure of middle or centrality. Common averages are the mean, median and mode. The mode for Room 5 data is four, the category with the highest frequency.
You could mimic writing all the data points in the graph, like this:
3, 3, 3, 3, 3, 4, 4, 4, 4, ….6, 6, 6, 7, 7, 8+
How will we find the middle number? You could count in one point at a time from the top and bottom. However, halving the total number of data points will give the location of the median. There are 5 + 9 + 7 + 3 + 2 + 1 = 27 data points (adding the frequencies) and 27 ÷ 2 = 13.5 so the median lies between the 13th and 14th data points. Both points lie in the bar for a four-person household, so the median is four.
It is easier to calculate the total of scores as (5 x 3) + (9 x 4) + (7 x 5) + (3 x 6) + (2 x 7) + 8 = 126. Note that 8+ is treated as eight though the actual number might be more than eight. 126 ÷ 27 = 4.66…
Therefore, the mean is closer to five people per household which reflects the fact that the median was ‘at the end’ of the four-person bar. It is interesting to reflect on the fact that two-thirds of a person is a mathematical rather than real idea, but it does suggest the centre is closer to five people than four.
For example, if five people live in a student’s household their clue might be:
“The median of 2, 9, 5, 8, 6, 3 and 4”, or “The mean of 1, 3, 4, 7, 7, 8.”
Distance from home to school
In the second part of the lesson students provide a clue about the location of their home. To do so they need to work out the distance of their home from school.
How far is 53mm in real life? (53 ÷ 32 = 1.67 and 1.67 x 200 = 334 metres in real life)
How far do you estimate the total journey is from Kiwi Street to Hilltop School? (1.6 – 1.8 kilometres)
Note that metres can be converted into kilometres. Do your students know how to do that?
Session Two allows you opportunity to assess students’ understanding of the following concepts:
Session Three
In this session students investigate two more clues to add to their poster. First, they investigate the Scrabble total for their given name. Then they create a personal icon, a sculpture made from connecting cubes. The icon will be used in Session Five to check that the person you identify is who you think they are.
Scrabble Total
Zoe’s letter score is 10 + 1 + 1 = 12. Hinemoa has a letter score of 4 + 1 + 1 + 1 + 1 + 1 + 1 = 10 and Kevin has a score of 5 + 1 + 4 + 1 + 1 = 12.
The Icon
Session Four
In this session students investigate a game involving chance. They play the game 25 times and express the result of their trial using a fraction, decimal or percentage.
What did you notice as you played the game? (Students should notice that the ‘even’ person wins more than the ‘odd’ person)
Why does the ‘even’ person win more? (There are more possible outcomes that give an even product)
How might we find out the actual chances of an odd or even win?
What are the products of these events, even or odd? (odd x odd = odd, even x odd = even, and even x even = even). Students might conclude that the chances of an odd product are one out of three or one third. While some good reasoning is involved to get to this point the conjecture is incorrect since even x odd can occur in two different orders. To establish the probabilities students must consider all the outcomes that contribute to each event.
Keep the two players secretly entering two digits, possibly using two calculators or digit cards. However, change the rules so the game is much fairer. How will you do that?
Session Five
In this session students receive the poster of another student, solve the clues and identify the unknown student in their class. Students will need access to copies of the spreadsheet. Once they think they know who the person is they confirm the identity by matching the three views with the icon in the classmate’s desk or tote tray.
During the session students might identify several students.
You might extend the unit by asking:
Cuisenaire Rod Fractions: Level 4
This unit introduces the fact that fractions come from equi-partitioning of one whole. Therefore, the size of a given length can only be determined with reference to the size of one whole. Usually the one must be defined in context.
‘Fractions as measures’ is arguably the most important of the five sub-constructs of rational number (Kieren, 1994) since it represents fractions as numbers, and is the basis of the number line. Fractions are needed when ones (wholes) are inadequate for a given purpose (e.g. division). In measurement, lengths are defined by referring to some unit that is named as one. When the size of another length cannot be accurately measured by a whole number of ones then fractions are needed.
For example, consider the relationship between the brown and orange Cuisenaire rods. If the orange rod is defined as one (an arbitrary decision) then what number do we assign to the brown rod?
Some equal partitioning of the one is needed to create unit fractions with one as the numerator. For the size of the brown rod to be named accurately those unit fractions need to fit into it exactly. We could choose to divide the orange rod into tenths (white rods) or fifths (red rods), either would work. By aligning the unit fractions we can see that the brown rod is eight tenths, or four fifths, of the orange rod.
Note that eight tenths and four fifths are equivalent fractions and that equality can be written as 8/10 = 4/5. These fractions are different names for the same quantity and share the same point on a number line. This idea, that any given point on the number line has an infinite number of fraction names, is a significant conceptual change compared to understanding of whole numbers. Some names are more privileged than others by our conventions. In the case of four fifths, naming it as eight tenths aligns to its decimal (0.8), and naming it as eighty hundredths aligns to its percentage (80/100 = 80%).
‘Fractions as operators’ is another of Kieren’s sub-constructs and applies to situations in which a fraction acts on another amount. Some examples are:
A confusion students sometimes have is when fractions should be treated as numbers and when they should be treated as operators. A particular case us when creating numbers lines, e.g. they often place 1/2 where 2 1/2 belongs on a zero to five number line.
Specific Teaching Points
Understanding that fractions are always named with reference to a one (whole) requires flexible thinking. Lamon (2007) described re-unitising and norming as two essential capabilities if students are to master fractions. By re-unitising she meant that students could flexibly define a given quantity in multiple ways by changing the units they attended to. "Norming" is the process of operating with new units. In this unit Cuisenaire rods are used to develop students’ skills in changing units and thinking with those units.
Multiplication of fractions involves adaptation of multiplication with whole numbers. Connecting 'a x b' as ‘a sets of b’ (or vice versa) with a/b x c/d as ‘a b-ths of c/d’ requires students to firstly create a referent whole. That whole might be continuous, like a region or volume, or discrete like a set. Expressing both fractions in a multiplication and the answer requires thinking in different units. Consider two thirds of one half (2/3 x 1/2) as modelled with Cuisenaire rods.
Let the dark green rod be one, then the light green rod is one half.
So which rod is two thirds of one half? A white rod is one third of light green so the red rod must be two thirds. Notice how we are describing the red rod with reference to the light green rod.
But what do we call the red rod? To name it we need to return to the original one; the dark green rod. The white rod is one sixth so the red rod is two sixths or one third of the original one. So the answer to the multiplication is 2/3 x 1/2 = 2/6 or 1/3.
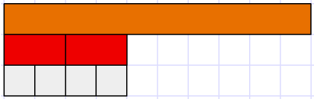
Reunitising and norming are important when fractions are placed in order of size (magnitude). This is especially true given any fraction has an infinite number of names. Imagine we use the orange rod as one this time and find two fifths. Since five red rods measure one whole (orange rod) then two red rods measure two fifths:
But, what other names does two fifths have? If the red rods were split in half they would be the length of white rods and be called tenths since ten of them would form one. The crimson rod is equal to four white rods which is a way to show that 2/5 = 4/10.
If the red rods were split into three equal parts the new rods would be called fifteenths since 15 of them would form one. The crimson rod would be equal to six of these rods which is a way to show 2/5 = 6/15. The process of splitting the unit fraction, fifths in this case, into equal smaller unit fractions, is infinite. This means that the point on the number line where two fifths exist has an infinite set of number names.
This unit is set for students to learn, and practice, outcomes at Level 4 of mathematics in the New Zealand Curriculum. Differentiation involves simplifying or adding more challenge to the tasks in the following ways:
The context for this unit is not real life. However, a story shell such as construction beams, waka lengths, or steps, might be used if there is potential to motivate students. Most students will enjoy the opportunity to work with Cuisenaire rods.
Te reo Māori vocabulary terms such as hautanga (fraction), hautau ōrite (equivalent fraction), tauira (patterns), tauraro (denominator) and taurunga (numerator) could be introduced in this unit and used throughout other mathematical learning.
Prior Experience
Students may have limited experience with using Cuisenaire rods. Their lack of familiarity with the rods is a significant advantage as they will need to imagine splitting the referent one to solve problems. When introducing the Cuisenaire rods, ask students to think about what they could be used to represent in mathematics. Value the contributions of all students.
Session One
Consider providing a story context to frame the learning in this session (e.g. construction beams, waka lengths, length of a running track). Links will be engaging when they reflect the cultural diversity and/or learning interests of your students. This context could stay consistent in every session. Alternatively, you could introduce each session with a new relevant context to enhance students’ understanding of the mathematical concepts covered in these lessons, to real-world situations.
What is the size of the crimson rod compared to the brown rod? How do you know?
The relationship between the crimson and brown rods can be expressed in two ways:
Encourage the students to express the relationships in various ways, such as:
How might we record these relationships mathematically?
Hopefully students will suggest recording an equality like this: 1/2 = 2/4 = 4/8.
Students should notice the doubling of both numerators and denominators. “Why does this happen?”
It is important to reinforce the idea that the numerator is a count, so the doubling of numerators indicates that there are twice as many parts in the same space.
Look for the students to notice that the denominators double because the parts halve in size - meaning twice as many quarters as halves fit into one, and twice as many eighths as quarters fit into one.
Ask: Imagine we had these new rods, grey and pale blue. What could you say about these new rods in relation to one (the brown rod)? How would you write the relationships mathematically? How are these fractions related to one half?
Look for students to establish grey as one sixteenth either by halving one eighth or realising that sixteen of the parts fit into one. Discuss the pale blue rod and its relation to the brown and grey rods. Equivalent fractions for one half can be found. Record these fractions as equalities:
1/2 = 8/16 and 1/2 = 3/6
Look for students to use numerator as a count and denominator as the number of equal parts that fit into one.
Session Two
Ask questions like:
If the dark blue rod is one what do we call the light green and white rods? Justify your answers.
What statements can you make about the relative size of the rods?
Can you create an equivalent fraction to two thirds using rods in the picture (2/3 = 6/9)? How might we record this equality?
The total is more than one half because two quarters is one half and one third is longer than one quarter.
Different rods might be tried but the white rod is the only unit that measures all three.
How many twelfths are the crimson rod (one third) and the light green rod (one quarter)?
How could we record these equalities? (1/3 = 4/12 and 1/4 = 3/12)
So what is the total length of one third plus one quarter? (seven twelfths)
How might we record this sum mathematically?
Where do the seven and the twelve in the answer come from?
Students might notice that if the sum is written as 1/3 + 1/4 = 4/12 + 3/12 = 7/12 then the origin of the seven and twelve are clear.
Why are twelve and twelve not added? The units are twelfths so we get “Four twelfths plus three twelfths equals seven twelfths.”
Session Three
In this session the purpose is to find the difference between two fractions. Difference is the often neglected context for subtraction though problems can also be solved by adding on.
Lelani got two thirds of a whole Cuisenaire rod and Sala got one half of the same sized Cuisenaire rod. Who got the most and how much more of one rod did they get?
Students might recognise that the difference is one sixth of the one (dark green). Scaffold this understanding if it is not demonstrated in discussion. Use physical materials to demonstrate the relationship. Ask how this problem might be recorded mathematically. Both addition and subtraction might be used:
1/2 + 1/6 = 2/3 or 2/3 - 1/2 = 1/6.
Look for students to recognise from previous sessions that both one half and two thirds can be expressed as sixths. So an extra step in the subtraction equation gives:
2/3 - 1/2 = 4/6 - 3/6 = 1/6
From this recording, students might realise that recording difference as subtraction is a little tidier and certainly more conventional than adding on.
Visually we can see that the difference between the two rods is five sixths which matches the calculation: 5/3 - 5/6 = 10/6 - 5/6 = 5/6.
Do the students start with two lengths, made with single rods (unit fractions) or collections of rods (non-unit fractions)?
Are they able to create a one (whole rod) that works for both rods?
Do they recognise what unit can be the common denominator and rename each fraction?
Can they find the difference and record the result as a subtraction equation?
Do they choose or create a one rod that has a length with many factors?, e.g. 18cm is useful but 19cm is not so useful.
Do they map other rods onto the one rod to create unit and non-unit fractions?
Can they name the fractions they create?
Do they use smaller rods to convert each fraction to equivalent forms before finding the difference?
Can they find the difference and record the result as a subtraction equation?
1/2 - 3/8 = 4/8 - 3/8 = 1/8
Session Four
The aim of this session is to develop students’ mental number line for fractions and develop their capacity to use the number line to find differences between fractions. Inclusion of fractions with whole numbers on the number line requires some significant adjustments. These adjustments include:
If the blue rod is one (mark zero and one on the number line) where would one third be? You could scaffold this further by marking zero and one on a number line below the Cuisenaire rod.
Note that there is no rod in the set that is one quarter, one fifth, one sixth, etc. of the blue rod. However, imaging how long the rods for these fractions would be is a useful activity in itself.
What fraction will this new rod represent? (eighteenths).
Can we express some of these fractions as eighteenths?
Can we find locations for numbers of eighteenths that are not showing yet?
Students might realise that having eighteenths allows them to find fractions exactly in the middle between numbers of ninths, e.g. 13/18 is exactly half way between 2/3 (6/9) and 7/9.
If I say dark green represents one half, how big is one?
Students should recognise that the fawn rod (12 cm) equals one (whole).
If dark green represents one half, what fraction is represented by the blue rod?
Students should realise that the blue rod represents three quarters, if the fawn rod equals one.
What fraction is the difference between one half and three quarters?
The light green rod is the difference and that rod represents one quarter. Record the difference using a subtraction equation.
3/4 - 1/2 = 1/4
The dark green rod is six twentieths or three tenths of the one rod.
The difference between three tenths and one quarter is one twentieth (the white rod).
The equation for the difference is 3/10 - 1/4 = 1/20 or 6/20 - 5/20 = 1/20
Lesson Five
What information is present?
What helpful information is missing?
You need to see this problem as a riddle. There is enough information to put any fraction you want on the number line.
What does to scale mean?
Look for the following:
Dear parents and caregivers,
This week your son or daughter will be learning about fractions, for example, three quarters and two thirds. We will be using some materials called Cuisenaire rods which are lengths of plastic or wood. They look like this:
Your son or daughter should be able to name fractions of a given rod. For example, they might say that the light green rod is three fifths of the yellow rod.
There is an online tool that lets you play with Cuisenaire rods on this page:
https://mathsbot.com/manipulatives/rods
Cool Times with Heat
In this unit we use thermometers to investigate questions about temperature. We explore questions relating to cooling patterns, the effect of location on temperature, and the results of mixing of water with different temperatures.
This unit is a useful connection to key science concepts such as experiment design, energy and insulation, and to recording, analysing, and reporting from data.
The focus of the unit is the attribute of temperature and how it is measured. Temperature is the amount of heat present in a substance. The standard unit of measurement for temperature in New Zealand is the degree Celsius (written ⁰C). Two benchmark temperatures ‘anchor’ the scale of degrees Celsius.
0⁰C is the freezing temperature of water at sea level, i.e. changes from liquid to solid (ice).
100⁰C is the boiling temperature of water at sea level, i.e. changes from liquid to gas (steam).
Temperatures below 0⁰C are recorded using negative numbers. For example, a temperature of -15⁰C is fifteen degrees below zero, the freezing point of water.
The learning opportunities in this unit can be differentiated by providing or removing support to students, by varying the task requirements. Ways to support students include:
Tasks can be varied in many ways including:
The contexts for this unit can be adapted to suit the interests and cultural backgrounds of your students. Temperatures related to places students are most familiar with, or have interest in, will provide motivating contexts. Use locations that students may have visited on holiday, or have whānau living at. Draw on the everyday experiences of water temperature, such as running a hot bath, swimming in the sea, a lake or river, and making ice-cold drinks on a hot day. Relate temperature to dressing for different weather conditions. Use contexts from history such as traditional cooking in thermal pools, ways that pre-European Māori stayed warm, and importance of fire.
Session One
What are these devices?
What do they do?
When is measuring temperature important? (testing for illness, keeping food cool, knowing what to wear, etc.)
How do liquid thermometers work? (As the liquid in the tube is heated it expands and takes up more space inside the tube)
What is missing from this liquid thermometer? (Markings)
What do the markings show? (Degrees in Celsius, sometimes Fahrenheit)
How is zero degrees decided? (Freezing temperature of water)
How is 100 degrees decided? (Boiling temperature of water)
You might look online to learn how the Celsius scale was developed, and why it is sometimes referred to as “centigrade.”
Invite estimates then check by giving each group a thermometer.
How accurate are our thermometers?
You might gather data about the temperature measurements of room temperature. Expect some variation as inexpensive thermometers are less accurate than scientific thermometers.
Tell the students to take the temperature reading every 30 seconds once the thermometer is immersed. One student will need to time the intervals with their watch, phone, or the class clock. The results should be recorded in a table like this:
Collect data for about ten minutes.
What trends appear in the graphs?
What will happen in the next ten minutes? Why?
Will the lines cross? Why, or why not?
Does the data match your prediction?
Why do the lines appear to be levelling off?
A key idea is that loss or gain in temperature of the water is a result of heat transfer between the water and the surrounding air. If the difference in temperature is great, then the rate of cooling or heating is greatest. As the water gets closer to room temperature the rate of cooling or heating gets less. For example, a hot cup of milo cools fastest straight after it is made.
The average temperature of water in Lake Taupō is ten degrees Celsius (10°C). The water in a bathing pool in the Polynesian Baths (Rotorua) is at a temperature of 32°C. Using the materials you have, mix two containers of water, one at each of these temperatures?
If both cups were left for two hours, what temperature would each cup of water be then? (Both will approximate to room temperature.)
Why?
Session Two
For the next 3 days the students will use thermometers to investigate questions about temperature. The first questions relate to cooling patterns.
Does wrapping a container of water in paper result in it cooling faster or slower?
How is the idea of wrapping containers of hot water useful in daily life? (Hot water cylinder cladding; wrapping of pipes in cold climates.)
How is the idea of wrapping used by us in everyday life? (Clothing, insulation of houses, etc.)
Session Three
What locations in Aotearoa have you visited when you were on holiday?
What were these places like? What highlights do you remember?
How did you know what clothing to take when you visited?
What factors make a difference to the temperature of a location?
Students will raise the idea that seasons influence temperature. Discuss the rotation of seasons and how that cycle relates for the axis rotation of the Earth as it orbits The Sun. There are many excellent videos depicting the seasons.
Temperature changes with the seasons. Are there permanent features that influence the temperature of a location all year round?
Students might raise factors such as closeness to the equator (measured by latitude), proximity to the coast, and altitude (measured by height above sea level). Make a list of the factors that students believe have a long-run effect on temperature.
Make a list of places to investigate. Each team of three students are allocated five locations from the list. Discuss the idea of average as being a measure of centre or middle, and the need to round decimals to the nearest whole number. Establish a protocol that coastal locations have a lowest altitude of zero metres and a distance to the sea of zero kilometres. Ask your students to find out the following data about each location.
Additionally, students could investigate cities worldwide and make comparisons between Aotearoa locations and other places around the world.
Gather the class for a korero.
We are trying to find out what factors affect the weather in a location over the long term.
Let’s ask some questions of the data.
Invite questions such as:
Are places further from the coast/higher in altitude/further from the equator cooler than those further inland?
Are locations in Te Ika-a-Māui (the North Island) hotter or colder than those in Te Waipounamu (the South Island)?
Do inland cities have a bigger average temperature range, between summer and winter, than coastal cities?
Are cities in the Northern hemisphere hotter or colder than those in the Southern hemisphere?
Encourage sharing and discussion of students’ thinking.
What do you expect the average temperature of Melbourne, Perth, Darwin, Brisbane, Alice Springs, Brisbane, Broome, Hobart to be like?
Will there be much variation between winter and summer in these cities?
Students may remember big variations in the temperature of Hobart and Melbourne caused by cold Southerly flows and hot Northerly flows. Temperatures in the tropical cities of Darwin, Broome and Brisbane tend not to vary much from winter to summer but humidity levels change considerably.
You may discuss the impact of humidity, and wind chill, on how temperature feels.
Session Four
In this session students investigate the use of integers (positive and negative numbers) in the Celsius scale.
How cold is negative thirteen degrees?
Has anyone in the class experienced a temperature like that?
How many degrees is each division on the scale? (10⁰C)
Investigate.
Why do parents and doctors often take your temperature when you are unwell?
If you have a temperature of 40⁰C should you seek medical advice?
Explain.
Session Five
Why was the water so cold when the air was warm?
Students will recall experiences when the water was hot and cold.
Today we will investigate what happens when we mix hot and cold water.
While some inaccuracies may occur due to the temperature transfer, in general the temperature of the mixture should be the mean (average) of the waters being mixed, i.e. 30°C + 10°C = 40°C, 40°C ÷ 2 = 20°C. On a number line the mean appears as the central point between the two measurements.
Simple averaging works when the amounts of water in each cup are the same.
How do you work out the mixture temperature when the amounts of water in each cup are different?
Extra problems
Problem One: Are we good at estimating water temperature?
Problem Two: Why do people wear light coloured clothing in the summer and dark clothing in the winter?
Problem Three: What times of the day are the hottest? What times are the coldest?
Family and whānau,
This week we have been looking at temperatures. We’d like you to do an experiment at home that can be reported to the class.
Temperature Problem
Take three ice blocks that are as close to being the same as possible.
Put one on a plate, one in a glass of cold water from the tap and one in a glass of hot water from a kettle.
Guess:
Bring your results to school by Thursday, and we’ll put all the data together to produce a class graph.
Figure It Out
Some links from the Figure It Out series which you may find useful are:
What's going on? Properties of multiplication and division
This unit develops students’ recognition of pattern (consistency) in equations involving multiplication and division with whole numbers.
This unit develops students’ recognition of pattern (consistency) in multiplication and division equations involving whole numbers. The patterns of pairs of equations embody important properties of multiplication and division, such as commutativity, distributivity, and inverse. Students learn to represent specific examples where the properties are used then provide convincing arguments about why the properties hold in all circumstances.
An important consequence is that students learn to consider variables as generalised numbers, and express relationships involving whole numbers under multiplication and division.
In this unit we build on research by Deborah Schifter, and colleagues, about the development of algebraic thinking. Shifter works for The Educational Development Centre, a non-profit research organisation in the USA. Her approach follows several steps that can be linked to ‘folding back’ in the Pirie-Kieren model of conceptual development, commonly used in New Zealand classrooms.
The phases of the approach are as follows:
In this unit, claims are developed through equation sets involving multiplication and division. The sets aim to develop students’ understandings of the properties of multiplication (commutativity, distributivity, associativity, identity and inverse). By expanding the equation sets to include division, students will learn how these properties hold, or do not hold, when the operation is changed.
The learning opportunities in this unit can be differentiated by providing or removing support to students and by varying the task requirements. The difficulty of tasks can be varied in many ways including:
The contexts for this unit are strictly mathematical but the materials used can be adapted. Physical items that have significance to your students might be better used than standard mathematical equipment. For example, if you have a big set of shells for environmental studies you might use those shells as the materials. Contexts may arise out of the preferred materials. Kaitiakitanga (guardianship over the environment) might be supported by finding clever ways to count the number of a particular animal or bird or pieces of rimurapa (seaweed) found in a section of the beach or parapare (barnacles) found attached to rocks at low tide. Whānaungatanga (family) values might involve finding fair and equitable ways to share shellfish that are harvested. Note that equal shares assumed in the operation of division are not always aligned to values of fair sharing.
Te reo Māori vocabulary terms such as ahuatanga koaro (commutative property), ahuatanga tohatoha (distributive property), koaro (inverse), whakawhanui (generalisations), tauwehe (factor) and otinga (product) could be introduced in this unit and used throughout other mathematical learning.
All lessons in this unit follow the same sequence of phases as given in the phase approach diagram shown. A poster of the phases is provided as Copymaster 1 for students to refer to. The notes suggest possible student ideas and teacher reactions to those responses. It is not feasible to anticipate all ideas students might give. Be flexible in how you respond to students, as opposed to focusing on teaching the sample ideas and representations provided.
PowerPoint 1 contains seven equation sets that drive the unit. The sets might form the basis of a week-long unit. The phases for each equation set are described below. The sets are labelled in the top left corner of each slide for reference.
Equation Pairs Set One
Slide one has the first pattern to look at. The pattern involves the commutative property, i.e. a x b = b x a, which students should be familiar with. It is used as an example to familiarise students with the approach.
Use ‘think, pair, share’ by inviting students to look independently at the four examples, work out the missing values, then share their ideas with a partner. In the class discussion expect students to express their observations in ways that are clear to others. Students should re-express their ideas if others do not understand what they are saying. You may need to remind students that the ‘something going on’ relates to all four examples, not just one. Expect responses like:
S: The numbers are just turned around, like 9 x 4 becomes 4 x 9.
T: Can you be more specific? Which numbers are turned around?
S: The numbers being multiplied each time.
Discussion opens the possibility of using correct mathematical terms, like factor (number being multiplied), and product (answer to multiplication).
S: The products (answers) are always the same.
T: All four patterns have the same product? What do you mean?
S: No. The products are the same when the factors are turned around.
Encourage students to state a claim about what is going on with all four examples in Pattern One. Initially, they might do this individually, before working in small teams to refine their ideas and the way they express those ideas. Encourage the mahi tahi model where students work collaboratively. Potential ideas may include:
If the factors are the same, and you turn them around, the product doesn’t change.
The first factor changes places with the second factor. The product is the same.
Aim for students to express their claims in clear, minimal terms, using correct mathematical language. For example, ‘turning around’ is not as clear as 'order of the factors'. You could compare different statements from groups of students, to highlight the importance of such clear language. Links could be made here to explanation writing (i.e. the need to be clear, informative, and concise).
In this phase students choose representations to show why the pattern holds consistently. Students might choose physical manipulatives, such as linking cubes or counters, draw diagrams such as number lines or arrays, and use contexts from everyday life. Encourage students to begin with the first two examples of equation pairs then consider how the same relationships might generalise to the last, and other similar, equation pairs.
Examples might be:
In this phase students are asked to formalise their "noticing" by creating a statement that can be generalised to all cases. The discussion may start with a specific equation pair but must be extended to describe what occurs in general.
S: With 7 x 5, one from each five makes a set of seven. Because there are five in the sets that means exactly five sevens can be made.
T: So how does that work in the same way with 9 x 4, 8 x 99, and 5 x 36?
This might lead to expressing the property in general terms.
S: The first factor multiplied by the second factor has the same product as the second factor multiplied by the first factor.
T: If we gave names to the first and second factors, like a and b, could we express the property more simply?
Some students might experiment with algebraic notation such as a x b = c so b x a = c, or may use symbols (e.g. emojis) to simplify their thinking. Note that this represents the starting equation pairs. In general, "a sets of b" can be remodelled - meaning taking one object from each set of b creates sets of size, a. This can be done b times, resulting in b x a (b sets of a).
T: Do we need to say both equations have an answer of c? Do we need c?
S: We could just write a x b = b x a.
Focus on the class of numbers that have been used, i.e. whole numbers. Encourage students to investigate if the commutative property holds for integers and rational numbers, e.g. If ½ x 36 = 18 does 36 x ½ = 18.
Equation Pairs Set Two
Ask the students to approach the second equations set more independently. Consider the needs of your students - it may be more appropriate for you to work with small groups, and to organise students in small groups or pairs for these tasks. From this point each equation set is discussed succinctly using the phases of the approach.
The four equations apply doubling and halving, thirding and trebling of the factors in the first equation. This strategy is sometimes called proportional adjustment since it underpins the concept of equivalent fractions. The completed sets should be:
8 x 3 = 24 6 x 10= 60
4 x 6 = 24 [Doubling 3, halving 8] 12 x 5 = 60 [Doubling 6, halving 10]
9 x 9 = 81 7 x 6 = 42
27 x 3 = 81 [Trebling 9, thirding 9] 14 x 3 = 42 [Doubling 7, halving 6]
Expect students to use phrases from their conversational language, such as “when one number doubles, the other halves”. Introduce important vocabulary such as factor (i.e. all the numbers that evenly divide a whole number -3 and 2 are factors of 6) and product (i.e. the result obtained when the numbers are multiplies together). This will help to clarify what numbers are being referred to in the claims. If the claim is restricted to doubling and halving, draw attention to 9 x 9 = 81 and 27 x 3 = 81. The aim is to broaden the claim to the equivalent of “one factor is divided by a number, n, the other factor is multiplied by n. The product stays constant (the same).”
Expect both physical and diagrammatic representations to be used. A cube stack representation might look like this:
Diagrams of a ‘sets’ representation might look like this:
Arrays might also be used as a powerful representation. Initially cubes might be used as units of area leading to a more abstract use of side lengths.
Look for students to justify that a given quantity, say 24, can be created by multiplying two factors, say 4 x 6. Keeping our quantity constant, one factor can be divided in equal parts, say each 6 is divided into three equal parts (3 twos). Now there are three times more of those parts making up 24. The number of parts a factor is divided into is a variable. Some students may be comfortable with using a label, like n, to represent the number of equal parts. The factors and product are also variables and might be represented with shapes or letters. Although symbolic representation is restricted at this level, algebraically the relationship might be expressed as:
Look for students to generalise ‘undoing’ nature of the inverse operations, i.e. divided by n, multiplied by n. At this level students are progressing towards the use of letters to represent variables. You might also introduce the quotient interpretation of fractions, e.g. a÷n can be expressed as a/n. Multiplication can also be represented without the x symbol, e.g. a×b can be represented as ab.
Equation Pairs Set Three
The four equations apply the distributive property. This property is used a lot in the multiplication of multi-digit numbers. The completed sets should be:
7 x 10 = 70 5 x 20= 100
7 x 11 = 77 [Adding 7 x 1] 5 x 22 = 110 [Adding 5 x 2]
9 x 50 = 450 6 x 100 = 600
9 x 53 = 477 [Adding 9 x 3] 6 x 105 = 630 [Adding 6 x 5]
Expect students to use phrases from their conversational language, such as “adding on so many lots of the number”. Encourage students to use of mathematical vocabulary such as factor and product to clarify what numbers are being referred to in the claims. You may need to model this for students. Encourage clarity by asking questions like:
Can you know how much more the second product is than the first? How?
What does the first factor mean? What does the second factor mean?
The aim is to state the claim as something like “If a number is added to the second factor, then the product increases by the first factor multiplied by that number.”
Expect both physical and diagrammatic representations to be used. Since most of the first equations involve multiples of ten or 100, place value blocks (MAB) might be useful.
Diagrams of tens and hundreds can be made schematic to highlight important structure.
Arrays illustrate how the first factor ‘acts’ on the second factor as it is changed.
Look for students to justify that two factors multiply to a given product. The starting product might be expressed as a x b. Adding a number to b results in the second factor becoming b + n (n is the number being added). The product increases by a x n. It is important for students to consider what is happening with all four equation sets, in that n is a variable, and can be ‘any number.’ Students are working towards expressing relationships among variables using letters and equations. Progress can be encouraged by working with the notations that students develop themselves.
Algebraically the relationship might be expressed as:
a×b so a×(b+n)=(a×b)+(a×n)
Multiplication can also be represented without the x symbol, e.g. a×b can be represented as ab, and unnecessary brackets (due to order of operations) can be removed.
ab so a(b+n)=ab+an
Equation Pairs Set Four
The four equations apply the inverse relationship between multiplication and division. This property is used by students to solve division problems by measurement, e.g. “How many x’s go into y? The completed sets should be:
8 x 6 = 48 7 x 3 = 21
48 ÷ 6 = 8 [expressing as division] 21 ÷ 3 = 7 [expressing as division]
12 x 25 = 300 68 x 9 = 612
300 ÷ 25 = 12 [expressing as division] 612 ÷ 9 = 68 [expressing as division]
In natural language expect the students to use phrases like “the factors are being put into a division equation.” Students might indicate what they see in a diagram.
Encourage and scaffold the use of mathematical vocabulary such as factor and product to clarify what numbers are being referred to in the claims. You may need to introduce division terms like divisor (number being divided by), quotient (answer to division) and dividend (the quantity being divided). Encourage clarity by asking questions like:
What does the second factor become in the division equation? (divisor)
What does the first factor become in the division equation? (quotient)
What does the second factor mean?
The aim is to state the claim as something like “Two factors multiply to give a product. The product divided by one factor equals the other factor.”
Expect both physical and diagrammatic representations to be used. Be aware that students may interpret division in two ways, as equal sharing (most common) or as measuring. Either interpretation can be used to represent the equations. Here is a measurement interpretation since 48 ÷ 6 is seen as “How many sixes are in 48?”
A sharing view interprets 48 ÷ 6 as “48 is equally shared among six parties. How much does each party get?”
Schematic diagrams, like arrays, show the factors as side lengths, and the product as the area. The missing number in an equation can be shown as an empty measure in the diagram.
Look for students to justify that if a product, a x b, is the multiplication of two factors a and b, then the product can be divided into sets of b or b sets of a. So the product in multiplication can be thought of as a dividend in division. Either factor can be the divisor, but the other factor is the quotient.
Look for students to accept that the factors and product are variables, meaning they can take up any value. The product is dependent on the factors so can always be represented as a x b, or ab.
Some students may use the repeated addition view of multiplication like this:
7 x 3 means seven sets of three, so seven sets of three can be made from 21.
a x b means a sets of b, so a sets of b can be made from ab.
Equation Pairs Set Five
The equation set applies proportional adjustment, halving, of the dividend and explores the effect on the quotient. This property can be used by students to solve division problems. The completed sets should be:
24 ÷ 4 = 6 40 ÷ 5 = 8
12 ÷ 4 = 3 [halving of dividend and quotient] 20 ÷ 5 = 4
264 ÷ 11 = 24 72 ÷ 9 = 8
132 ÷ 11 = 12 144 ÷ 9 = 16
In natural language expect the students to use phrases like “halving the number being divided halves the answer.”
Expect the use of mathematical vocabulary associated with division, like divisor (number being divided by), quotient (answer to division), and dividend (the quantity being divided). Encourage clarity by asking questions like:
What changes in each pair of equations?
What stays the same?
Look at equation four. It is different from the others. How?
The aim is to state the claim as something like “Multiplying or dividing the dividend by a number, while keeping the divisor the same, results in the quotient being multiplied or divided by the same number.”
Both equal sharing, or measuring interpretations of division can be used to model the relationships in the equation pairs. Sets models, like stacks of cubes, work well but encourage the progress towards schematic diagrams like arrays.
Note that the fourth equation pair shows the effect of multiplying both dividend and quotient by two.
Look for students to justify, using words or diagrams rather than symbols. If the divisor stays the same then dividing the dividend by a number results in the quotient being divided by the same number. Similarly, multiplying the dividend by a number results in the quotient also being multiplied by that number.
Look for students to accept that the dividend and divisor are variables, meaning they can take up any value.
Be aware that some students may transfer the repeated addition view of multiplication to division like this:
8 x 5 means eight sets of five, which totals 40. So, with half that total, 20, it is possible to make half as many fives.
If the factors are regarded as variables, then a more general finding might be ‘proven’ geometrically with arrays.
Algebraically this might be expressed as , "If a amounts of b equal ab, then a/2 amounts of b equal half of ab (ab/2)."
Equation Pairs Set Six
The equation set highlights the difference of squares. This property can be used by students to solve multiplication problems. The completed sets should be:
9 x 9 = 81 5 x 5 = 25
8 x 10 = 80 [One less than 81] 4 x 6 = 24 [One less than 25]
20 x 20 = 400 12 x 12 = 144
21 x 19 = 399 [One less than 400] 13 x 11 = 143 [One less than 144]
Expect students to use phrases from their conversational language, such as “The first equation has the same factor times itself. The second equation has one more and one less and the answer is one less.” Ask students to be more specific in their description.
Which factor is increased by one?
Which factor is decreased by one?
Is this true for all four equations?
The aim is to state the claim as something like “If a number is chosen, one less than the number, multiplied by one more than the number, equals the square of the number less one.”
Students are likely to use specific examples to convince others about how the relationships work.
Arrays are a useful representation to ‘prove’ what occurs with the difference of perfect squares.
In general, a2 can be transformed spatially into (a-1)(a+1) by removing one (1 x 1) and moving the unit of (a-1) to create a rectangle with sides of (a-1) and (a+1).
Students are not expected to use algebraic notation at this level. High achieving students might like to see that the transformation can be represented as:
(a-1)(a+1) = a2-a+ a -1 = a2 -1
Equation Pairs Set Seven
Use set seven as an opportunity to see how well students engage in the generalisation process independently. Ask them to record their claims, representations, and arguments in ways that work for them. Some students may prefer writing their work while others may prefer to capture their ideas using a digital recording tool (e.g. Google drawings).
The equation set highlights the division equivalent of the distributive property. The dividend is reduced by a multiple of the divisor. This property is used to solve division problems by rounding the dividend up, e.g. 76 ÷ 4 by calculating 80 ÷ 4 first. The completed sets should be:
80 ÷ 8 = 10 60 ÷ 5 = 12
72 ÷ 8 = 9 [One less set of 8] 55 ÷ 5 = 11 [One less set of 5]
270 ÷ 9 = 30 700 ÷ 7 = 100
261 ÷ 9 = 29 [One less set of 9] 686 ÷ 7 = 98 [Two less sets of 7]
Expect students to use phrases from their conversational language, such as “the first equation has a dividend divided by a divisor. The second equation has one or two times the divisor taken off the dividend, so the quotient is one or two less.” Ask students to be more specific in their description. Diagrams might be useful.
Ask questions like:
Show how the dividend is decreased by one or two times the divisor.
What is the effect on the quotient?
Is this true for all four equations?
The claim using mathematical language might be something like, “If the dividend is reduced by one times the divisor, then the quotient is reduced by one.” Note that the fourth equation pair reduces the dividend by two times the divisor.
Given the dividends are multiples of ten or 100, place value blocks (MAB) might be a suitable representation.
Schematic diagrams, like arrays, provide a clearer view of the structure found in examples.
Be aware students might go back to the repeated addition view of multiplication to convince others about their claim. Validate the use of this strategy, and encourage students to develop their use of "noticing regularity". A specific example might look like this:
Dear family and whānau,
This week we have been exploring the properties of multiplication and division. Can your child explain the relationship between multiplication and division?
Ask your child to show you some of the new strategies they have been examining. For example, how to solve;
5 x 26 or 5 x 42
Or how to solve 72 divided by 8 through having the information 80 divided by 8 = 10
Measuring up
In this unit the students will collect statistical data about their own class and school and learn how to compare it to data from students from CensusAtSchool.
By Level 4 students are able to take increasing responsibility for the planning and conducting of statistical investigations. Students should be capable now of incorporating technology into their work.
Informal measures of centre and spread (at curriculum level 4)
Formal measures of centre and spread are introduced at curriculum level 5. If your students are ready to explore these then look to curriculum level 5 activities. At curriculum level 4 we introduce the ideas of the middle and the middle 50% of numerical data. We can match the middle of the data on a graph up with the median in an informal sense using technology. We can identify the middle and the middle 50% using technology or marking by eye on a physical graph.
The learning opportunities in this unit can be differentiated by providing or removing support to students and by varying the task requirements. Ways to support students include:
The context for this unit can be adapted to suit the interests and experiences of your students. For example:
Session 1: Measuring the class
PROBLEM: Generating ideas for statistical investigation and developing investigative questions
Research online information about sizing guides as well.
Note: that some students may be sensitive about being measured. It is not appropriate to measure weight. Ideas around the ethics of data collection are attended to in 4. Students who do not want to be measured could become the measurer for a measurement station.
PLAN: Planning to collect data to answer our investigative question
Session 2: DATA: Collecting and organising data
ANALYSIS introduction: Using an online tool to make data displays
In the remaining time for the session, the students will be introduced to using an online tool for data analysis. One suggested free online tool is CODAP. Feel free to use other tools you are familiar with. This is written with CODAP as the online tool and is assuming students have not used CODAP before. If your students are familiar with CODAP then they can move straight into analysing the data from the class survey.
If you do not want to use an online tool then head to the making displays part and progress with paper versions of bar graphs, dot plots and histograms.
Learning how to use CODAP
Session 3: ANALYSIS: Displaying and describing the data
Students use data from the previous session to produce graphs in CODAP or similar statistical analysis software.
Example of a categorical graph in CODAP:
Example of a numerical graph in CODAP:
We might explore what is missing from the height graph (units) and show students how to include the units in the graph.
Click on the variable in the table or case card view. This gives a pop-up menu.
Select edit attribute properties, and in the pop-up window type in the unit (cm), and click apply.
This updates the graph to show the units.
Students can update all the measurement variables in the table to include the units of measure.
Click on the graph to bring up the tool bar. Select the graph icon and then select 'Fuse Dots into Bars' to make a bar graph.
Click on the graph to bring up the tool bar. Select the graph icon and then select 'Group into Bins' (note the different option when numerical data is recognised).
This action groups the dots into bins. Click on the graph icon again and now the options for 'Bin width', 'Alignment' and 'Fuse Dots into Bars' comes up. Generally, go with the default settings for bin width and alignment; then select 'Fuse Dots into Bars'.
The resulting graph is:
Students can explore changing the bin width and the alignment. What happens when the alignment is changed?
Students can compare the dot plot with the histogram and have a korero about what is similar and what is different. What are the advantages of the dot plot? What are the advantages of the histogram?
Remind them that they can use multiple displays to show different features of the data to answer their investigative questions.
Students describe their data displays. A good starter is using “I notice…” as students start to notice features of their displays. For numerical data they might notice:
For categorical data they might notice:
All statements in the descriptions need to include the name of the variable and the group, and for numerical data, the value and the units as well.
CONCLUSION: Answering the investigative question and reporting findings
Session 4: Comparing to students like us in New Zealand
The class will use data from CensusAtSchool to compare to their class results.
Note also that the different group sizes might be a sticking point for students as they may not think they are able to compare different sized groups. Get them to focus on the summary information e.g. where is most of the data, where does the data peak, what is the biggest value, the smallest value, the middle value, how do these compare? These were the suggested features from the description of their class data.
Note: If the students have all downloaded their own individual samples from CensusAtSchool the discussions each student makes could be quite different. If you want them all to have the same sample from CensusAtSchool you can download a sample yourself, import into CODAP and then share the CODAP document with your students (see this video on saving and sharing CODAP documents).
Session 5: ANALYSIS: Going deeper - investigating the middle and the middle 50% of our data using CODAP
Note that measures of centre are not introduced in The New Zealand Curriculum until level 5. At curriculum level 4 we introduce informal ideas of the middle and the middle 50%
Describing the middle
Students to work with their class data initially. The example given is for heights, but the ideas are the same for any numerical data.
Introducing the idea of the median, this is the middle of the data
Repeat the idea for the data they have from CensusAtSchool.
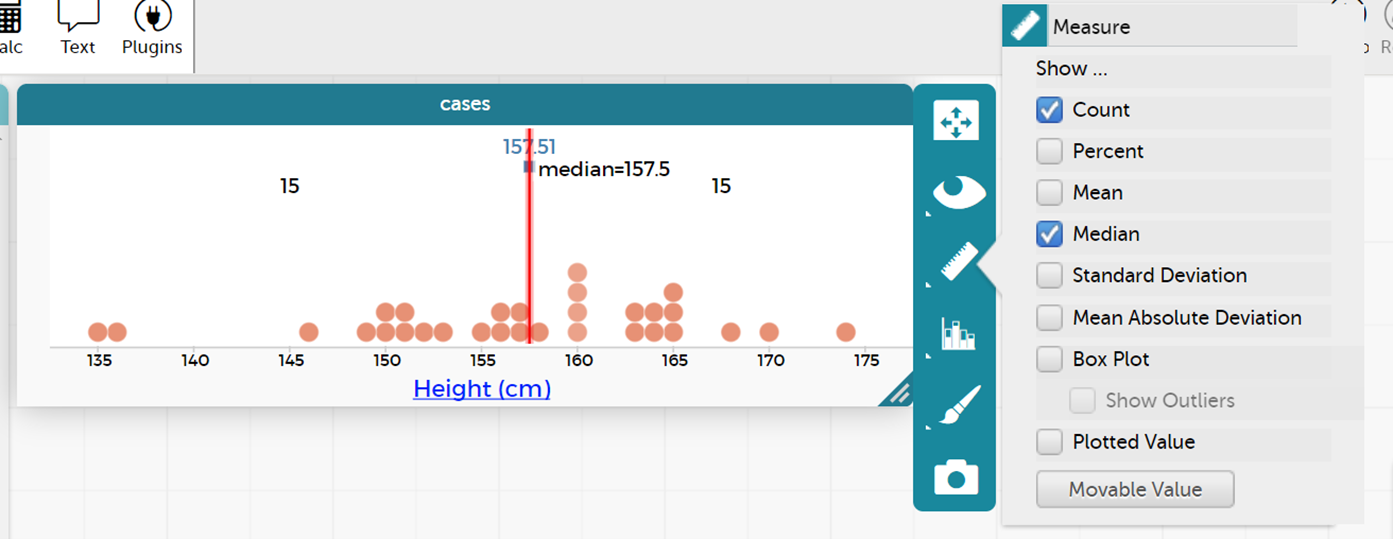
This special value, the median, can be found using the CODAP measures tool. Click on the ruler and then select median. They should get a red line showing the 'Median'. By hovering over this red line, they can find the median value, e.g. for first height example see picture below. They can also notice how close their guess at the middle was to the actual median (the middle of the values when placed in order from smallest to largest).
Introduce the idea of the middle 50% of the data
The “signal” for the data is often where the middle 50% of the data is.
Repeat idea for the CensusAtSchool sample heights data.
Making comparisons between our class data and the CensusAtSchool sample data
With these two additional pieces of information – the middle (median) and the middle 50% update your discussion around the similarities and differences between the class data and the CensusAtSchool sample data. Ensure students support each other and have opportunities to experience both tuakana and teina roles as they do this.
Dear parents and whānau,
At school this week we will be measuring the heights of the students in the class and comparing our results to the heights of students around Aotearoa. As another comparison we would like to be able to talk about the heights of family members. Could you please help your child measure the heights of their family members and record the information to bring to school?
Can each person in the family answer the following survey question:
How tall are you without your shoes on (answer to the nearest cm)?
Thank you.
Figure it Out Links
Some links from the Figure It Out series which you may find useful are: